
Yorkville South Calgary MLS® Listings
Houses, Condos and Real Estate For Sale by Calgary REALTORS®.
Yorkville Market Snapshot
September 2026 · all residential property types
In September 2026, the benchmark price for Yorkville was $560,600, down 2.0% from September last year. 8 homes sold (up 14%), 11 new listings came on the market (up 10%), and there were 17 active listings at month end (down 11%). Among homes that sold, the median sale price was $714,000 (up 41.4%) and the average sale price was $640,935 (up 10.8%), and homes sold for 97.0% of their asking price. That is 2.1 months of supply, and homes spent 49 days on the market (down 0 days). Figures cover all residential property types.
View the numbers
| Measure | September 2026 | September last year |
|---|---|---|
| Benchmark price | $560,600 | $572,300 |
| Median price | $714,000 | $505,000 |
| Average price | $640,935 | $578,431 |
| Sold vs asking | 97.0% | 98.0% |
| Homes sold | 8 | 7 |
| New listings | 11 | 10 |
| Active listings | 17 | 19 |
| Months of supply | 2.1 | 2.7 |
| Days on market | 49 | 49 |
12-month trend
View the monthly numbers
| Month | Benchmark price | Sold | New listings | Active listings | Months of supply | Days on market | Median price | Average price | Sold vs asking |
|---|---|---|---|---|---|---|---|---|---|
| Oct 2025 | $567,600 | 6 | 9 | 18 | 3.0 | 40 | $643,017 | $627,672 | 97.0% |
| Nov 2025 | $557,500 | 9 | 5 | 12 | 1.3 | 51 | $625,000 | $599,769 | 96.0% |
| Dec 2025 | $556,000 | 3 | 6 | 12 | 4.0 | 62 | $521,990 | $597,330 | 96.0% |
| Jan 2026 | $558,500 | 0 | 10 | 19 | n/a | n/a | n/a | n/a | n/a |
| Feb 2026 | $555,200 | 10 | 6 | 11 | 1.1 | 49 | $660,500 | $635,289 | 98.0% |
| Mar 2026 | $564,500 | 7 | 7 | 11 | 1.6 | 35 | $625,000 | $629,414 | 98.0% |
| Apr 2026 | $561,900 | 6 | 12 | 15 | 2.5 | 55 | $486,995 | $560,580 | 98.0% |
| May 2026 | $556,500 | 7 | 9 | 15 | 2.1 | 37 | $760,000 | $675,927 | 98.0% |
| Jun 2026 | $561,100 | 6 | 8 | 15 | 2.5 | 47 | $721,000 | $675,165 | 97.0% |
| Jul 2026 | $559,300 | 1 | 6 | 17 | 17.0 | 47 | $662,990 | $662,990 | 100.0% |
| Aug 2026 | $556,900 | 3 | 8 | 15 | 5.0 | 68 | $635,000 | $607,500 | 97.0% |
| Sep 2026 | $560,600 | 8 | 11 | 17 | 2.1 | 49 | $714,000 | $640,935 | 97.0% |
September 2026 · detached homes
In September 2026, the benchmark price for Yorkville was $753,900, down 1.7% from September last year. 5 homes sold (up 150%), 5 new listings came on the market (down 29%), and there were 9 active listings at month end (down 25%). Among homes that sold, the median sale price was $735,000 (up 1.4%) and the average sale price was $733,298 (up 1.1%), and homes sold for 97.0% of their asking price. That is 1.8 months of supply, and homes spent 47 days on the market (down 19 days). Figures cover detached homes.
View the numbers
| Measure | September 2026 | September last year |
|---|---|---|
| Benchmark price | $753,900 | $766,700 |
| Median price | $735,000 | $725,013 |
| Average price | $733,298 | $725,013 |
| Sold vs asking | 97.0% | 97.0% |
| Homes sold | 5 | 2 |
| New listings | 5 | 7 |
| Active listings | 9 | 12 |
| Months of supply | 1.8 | 6.0 |
| Days on market | 47 | 66 |
12-month trend
View the monthly numbers
| Month | Benchmark price | Sold | New listings | Active listings | Months of supply | Days on market | Median price | Average price | Sold vs asking |
|---|---|---|---|---|---|---|---|---|---|
| Oct 2025 | $764,700 | 4 | 2 | 9 | 2.3 | 51 | $670,517 | $696,508 | 97.0% |
| Nov 2025 | $751,500 | 5 | 2 | 5 | 1.0 | 61 | $635,000 | $663,407 | 95.0% |
| Dec 2025 | $749,300 | 1 | 4 | 6 | 6.0 | 115 | $780,000 | $780,000 | 98.0% |
| Jan 2026 | $746,900 | 0 | 4 | 9 | n/a | n/a | n/a | n/a | n/a |
| Feb 2026 | $750,800 | 6 | 2 | 4 | 0.7 | 50 | $713,000 | $728,481 | 98.0% |
| Mar 2026 | $760,000 | 3 | 3 | 4 | 1.3 | 59 | $782,000 | $765,667 | 98.0% |
| Apr 2026 | $756,500 | 1 | 10 | 12 | 12.0 | 12 | $875,000 | $875,000 | 99.0% |
| May 2026 | $754,900 | 4 | 4 | 12 | 3.0 | 47 | $795,000 | $817,875 | 98.0% |
| Jun 2026 | $759,700 | 4 | 5 | 11 | 2.8 | 56 | $729,000 | $759,250 | 98.0% |
| Jul 2026 | $755,500 | 1 | 4 | 12 | 12.0 | 47 | $662,990 | $662,990 | 100.0% |
| Aug 2026 | $758,200 | 2 | 4 | 9 | 4.5 | 54 | $637,500 | $637,500 | 98.0% |
| Sep 2026 | $753,900 | 5 | 5 | 9 | 1.8 | 47 | $735,000 | $733,298 | 97.0% |
September 2026 · row and townhouse homes
In September 2026 in Yorkville, 3 homes sold (down 25%), 4 new listings came on the market (up 100%), and there were 5 active listings at month end (unchanged). Among homes that sold, the median sale price was $485,000 (down 2.5%) and the average sale price was $486,997 (down 1.8%), and homes sold for 97.0% of their asking price. That is 1.7 months of supply, and homes spent 53 days on the market (up 11 days). Figures cover row and townhouse homes.
View the numbers
| Measure | September 2026 | September last year |
|---|---|---|
| Median price | $485,000 | $497,500 |
| Average price | $486,997 | $495,748 |
| Sold vs asking | 97.0% | 98.0% |
| Homes sold | 3 | 4 |
| New listings | 4 | 2 |
| Active listings | 5 | 5 |
| Months of supply | 1.7 | 1.3 |
| Days on market | 53 | 42 |
12-month trend
View the monthly numbers
| Month | Benchmark price | Sold | New listings | Active listings | Months of supply | Days on market | Median price | Average price | Sold vs asking |
|---|---|---|---|---|---|---|---|---|---|
| Oct 2025 | n/a | 2 | 3 | 4 | 2.0 | 17 | $490,000 | $490,000 | 99.0% |
| Nov 2025 | n/a | 3 | 3 | 3 | 1.0 | 30 | $492,888 | $496,629 | 97.0% |
| Dec 2025 | n/a | 1 | 2 | 4 | 4.0 | 28 | $490,000 | $490,000 | 95.0% |
| Jan 2026 | n/a | 0 | 3 | 6 | n/a | n/a | n/a | n/a | n/a |
| Feb 2026 | n/a | 3 | 3 | 4 | 1.3 | 51 | $462,000 | $460,667 | 98.0% |
| Mar 2026 | n/a | 2 | 3 | 5 | 2.5 | 13 | $496,950 | $496,950 | 99.0% |
| Apr 2026 | n/a | 3 | 1 | 2 | 0.7 | 67 | $483,500 | $478,497 | 98.0% |
| May 2026 | n/a | 3 | 2 | 0 | n/a | 25 | $493,000 | $486,663 | 99.0% |
| Jun 2026 | n/a | 0 | 3 | 3 | n/a | n/a | n/a | n/a | n/a |
| Jul 2026 | n/a | 0 | 2 | 4 | n/a | n/a | n/a | n/a | n/a |
| Aug 2026 | n/a | 0 | 3 | 5 | n/a | n/a | n/a | n/a | n/a |
| Sep 2026 | n/a | 3 | 4 | 5 | 1.7 | 53 | $485,000 | $486,997 | 97.0% |
Source: Calgary Real Estate Board (CREB®) monthly statistics. Benchmark price is the typical price of a home in the area. Median and average prices are for homes that sold in the month. Figures can be revised.
Sign Up for free
Get the first to receive the latest listing updates, save favorites & much more by signing up. Or already have in account,Sign in.
Yorkville MLS® Listings - Houses, Condos and Real Estate For Sale in South Calgary
- All Listings
- $400,000 - $500,000
- $500,000 - $600,000
- $600,000 - $700,000
- $700,000 - $800,000
- $800,000 - $900,000
- $900,000 - $1,000,000






About Yorkville
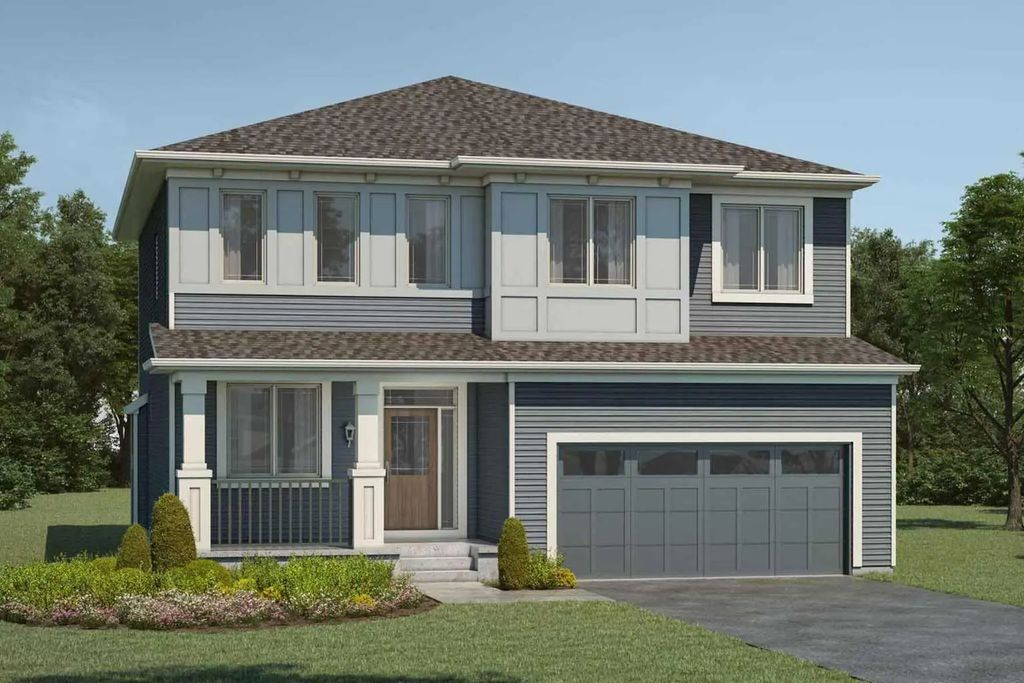
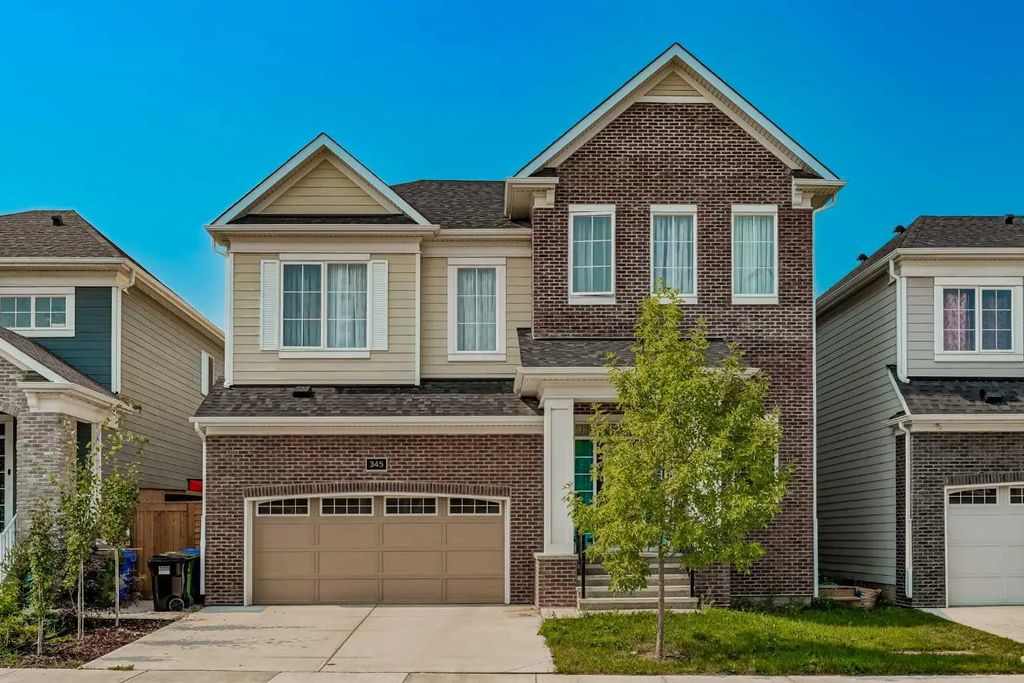
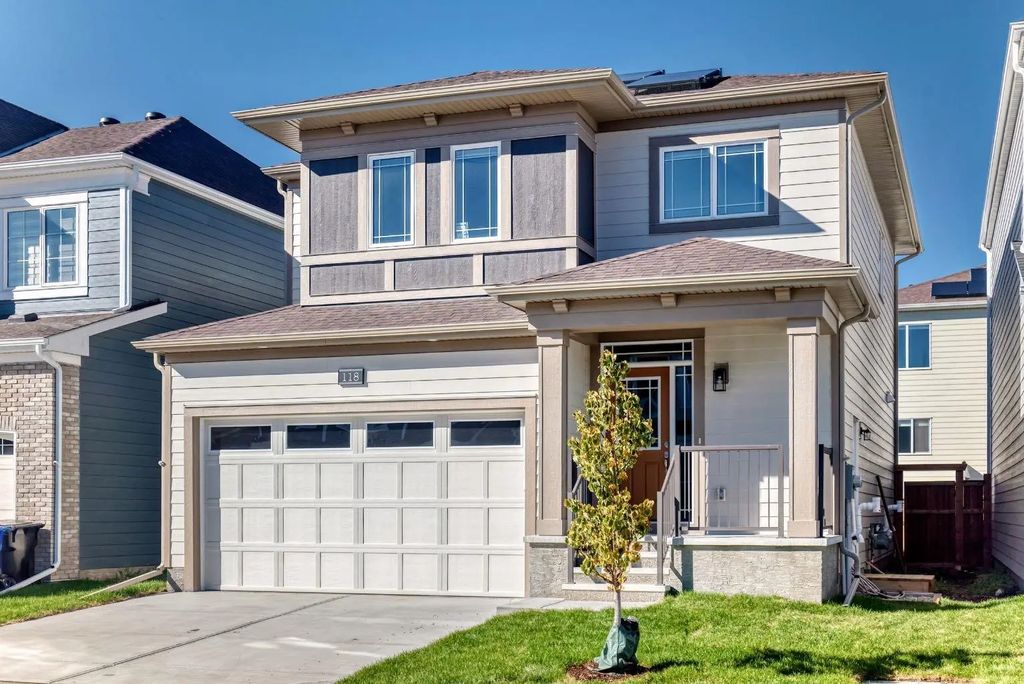
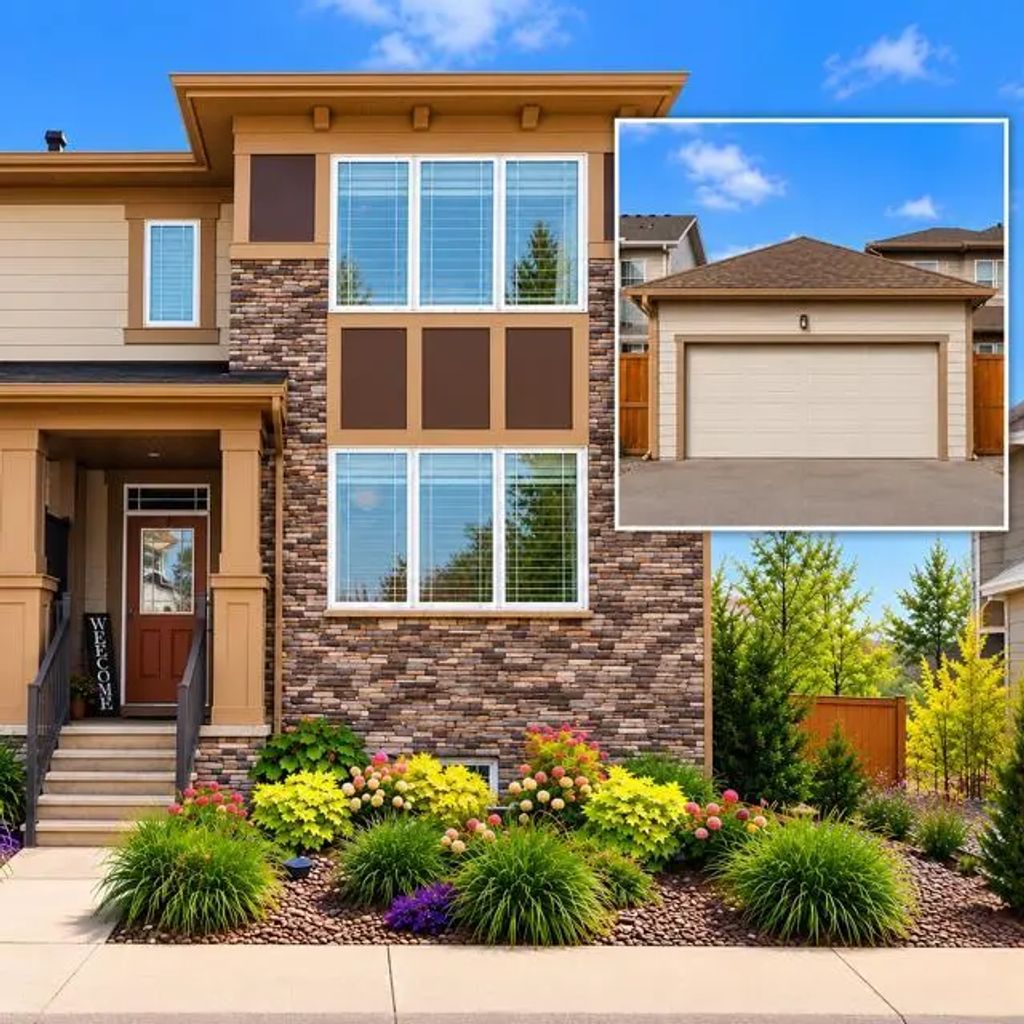
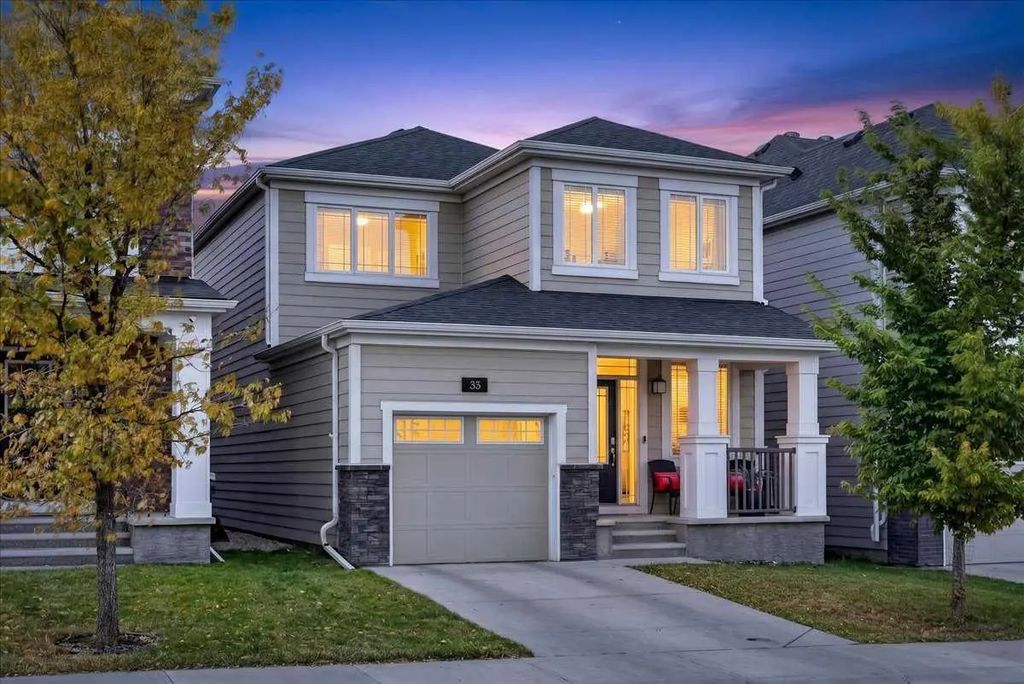
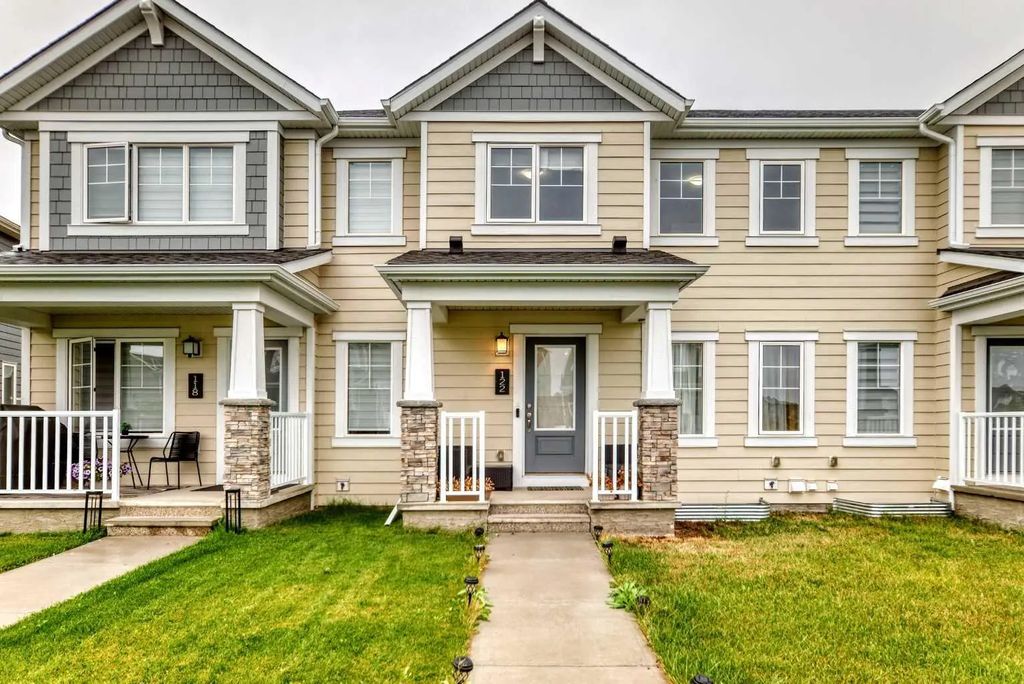
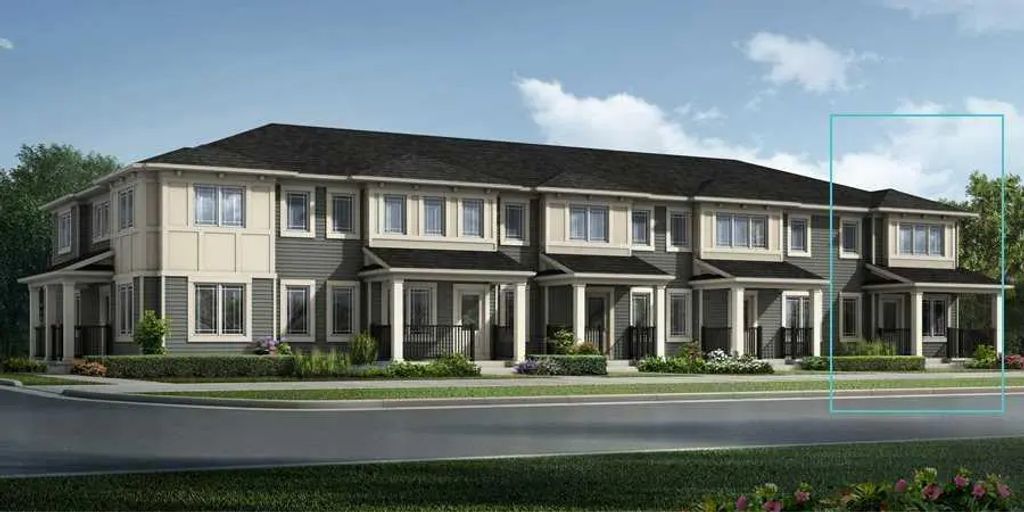
Yorkville is a developing residential community in south Calgary, located within the Pine Creek area near Macleod Trail and Stoney Trail. Planned as a family-friendly neighbourhood, Yorkville features a mix of single-family homes, townhomes and low-rise condos built by local developers with modern architectural styles. The community is close to parks, pathways and green space, with convenient access to shopping, schools and other amenities in south Calgary. Yorkville's location provides easy commuting access to the rest of the city via major roadways, making it an appealing option for buyers seeking new construction in a growing part of Calgary.
Frequently Asked Questions
What type of homes are available in Yorkville?
Yorkville offers a range of housing options including single-family homes, townhomes and condos, many of which are new builds from local developers.
Where is Yorkville located in Calgary?
Yorkville is located in south Calgary, part of the Pine Creek area near Macleod Trail and Stoney Trail, giving residents convenient access to other south Calgary communities.
Is Yorkville a good place for families?
Yorkville's mix of new homes, nearby parks and green space, and proximity to schools and amenities make it a popular choice for families and first-time buyers.
Featured Neighbourhoods in South Calgary
- Acadia
- Bayview
- Belmont
- Bonavista Downs
- Braeside
- Bridlewood
- Canyon Meadows
- Canyon Meadows Estates
- Cedarbrae
- Chaparral
- Chinook Park
- Deer Ridge & Deer Run
- Diamond Cove
- Eagle Ridge
- Evergreen
- Evergreen Estates
- Fairview
- Haysboro
- Kelvin Grove
- Kingsland
- Lake Bonavista
- Lake Bonavista Estates
- Legacy
- Maple Ridge
- Midnapore
- Millrise
- Oakridge
- Oakridge Estates
- Palliser
- Parkland
- Pine Creek
- Pump Hill
- Queensland
- Shawnee Slopes
- Shawnessy
- Silverado
- Somerset
- Southwood
- Sundance
- Walden
- Willow Park
- Willow Park Estates
- Willow Ridge Community
- Wolf Willow
- Woodbine & Woodlands
- Yorkville
- Alpine Park