
Sundance South Calgary MLS® Listings
Houses, Condos and Real Estate For Sale by Calgary REALTORS®.
Sundance Market Snapshot
September 2026 · all residential property types
In September 2026, the benchmark price for Sundance was $749,700, down 1.0% from September last year. 13 homes sold (up 63%), 11 new listings came on the market (up 57%), and there were 11 active listings at month end (down 15%). Among homes that sold, the median sale price was $745,000 (up 13.3%) and the average sale price was $820,792 (up 24.9%), and homes sold for 99.0% of their asking price. That is 0.9 months of supply, and homes spent 22 days on the market (down 7 days). Figures cover all residential property types.
View the numbers
| Measure | September 2026 | September last year |
|---|---|---|
| Benchmark price | $749,700 | $756,900 |
| Median price | $745,000 | $657,500 |
| Average price | $820,792 | $657,188 |
| Sold vs asking | 99.0% | 97.0% |
| Homes sold | 13 | 8 |
| New listings | 11 | 7 |
| Active listings | 11 | 13 |
| Months of supply | 0.9 | 1.6 |
| Days on market | 22 | 29 |
ShowHide 12-month trend
View the monthly numbers
| Month | Benchmark price | Sold | New listings | Active listings | Months of supply | Days on market | Median price | Average price | Sold vs asking |
|---|---|---|---|---|---|---|---|---|---|
| Oct 2025 | $761,400 | 6 | 12 | 15 | 2.5 | 40 | $734,000 | $701,917 | 98.0% |
| Nov 2025 | $734,000 | 3 | 8 | 14 | 4.7 | 33 | $700,000 | $654,667 | 98.0% |
| Dec 2025 | $731,300 | 4 | 2 | 7 | 1.8 | 44 | $590,000 | $585,375 | 98.0% |
| Jan 2026 | $727,000 | 6 | 10 | 8 | 1.3 | 25 | $680,000 | $672,250 | 100.0% |
| Feb 2026 | $752,200 | 6 | 8 | 9 | 1.5 | 27 | $647,500 | $673,500 | 99.0% |
| Mar 2026 | $757,200 | 8 | 13 | 11 | 1.4 | 15 | $755,500 | $732,688 | 101.0% |
| Apr 2026 | $771,000 | 14 | 21 | 17 | 1.2 | 15 | $668,750 | $711,593 | 100.0% |
| May 2026 | $781,600 | 17 | 17 | 14 | 0.8 | 23 | $730,000 | $734,625 | 100.0% |
| Jun 2026 | $769,400 | 12 | 12 | 12 | 1.0 | 23 | $659,000 | $675,967 | 99.0% |
| Jul 2026 | $766,600 | 5 | 15 | 16 | 3.2 | 20 | $840,000 | $834,900 | 98.0% |
| Aug 2026 | $751,400 | 11 | 16 | 16 | 1.5 | 26 | $700,000 | $822,516 | 98.0% |
| Sep 2026 | $749,700 | 13 | 11 | 11 | 0.9 | 22 | $745,000 | $820,792 | 99.0% |
September 2026 · detached homes
In September 2026, the benchmark price for Sundance was $751,900, down 0.9% from September last year. 11 homes sold (up 57%), 10 new listings came on the market (up 67%), and there were 10 active listings at month end (down 9%). Among homes that sold, the median sale price was $770,000 (up 12.4%) and the average sale price was $874,982 (up 29.6%), and homes sold for 99.0% of their asking price. That is 0.9 months of supply, and homes spent 20 days on the market (down 11 days). Figures cover detached homes.
View the numbers
| Measure | September 2026 | September last year |
|---|---|---|
| Benchmark price | $751,900 | $759,100 |
| Median price | $770,000 | $685,000 |
| Average price | $874,982 | $675,143 |
| Sold vs asking | 99.0% | 96.0% |
| Homes sold | 11 | 7 |
| New listings | 10 | 6 |
| Active listings | 10 | 11 |
| Months of supply | 0.9 | 1.6 |
| Days on market | 20 | 31 |
ShowHide 12-month trend
View the monthly numbers
| Month | Benchmark price | Sold | New listings | Active listings | Months of supply | Days on market | Median price | Average price | Sold vs asking |
|---|---|---|---|---|---|---|---|---|---|
| Oct 2025 | $763,500 | 5 | 10 | 12 | 2.4 | 39 | $750,000 | $743,100 | 98.0% |
| Nov 2025 | $735,700 | 3 | 7 | 13 | 4.3 | 33 | $700,000 | $654,667 | 98.0% |
| Dec 2025 | $733,200 | 4 | 2 | 7 | 1.8 | 44 | $590,000 | $585,375 | 98.0% |
| Jan 2026 | $729,000 | 6 | 9 | 7 | 1.2 | 25 | $680,000 | $672,250 | 100.0% |
| Feb 2026 | $754,300 | 6 | 7 | 7 | 1.2 | 27 | $647,500 | $673,500 | 99.0% |
| Mar 2026 | $759,400 | 8 | 12 | 8 | 1.0 | 15 | $755,500 | $732,688 | 101.0% |
| Apr 2026 | $773,200 | 11 | 18 | 15 | 1.4 | 16 | $676,500 | $747,945 | 99.0% |
| May 2026 | $783,900 | 17 | 14 | 11 | 0.7 | 23 | $730,000 | $734,625 | 100.0% |
| Jun 2026 | $772,000 | 10 | 12 | 11 | 1.1 | 23 | $675,250 | $700,460 | 99.0% |
| Jul 2026 | $769,300 | 5 | 14 | 15 | 3.0 | 20 | $840,000 | $834,900 | 98.0% |
| Aug 2026 | $753,600 | 10 | 14 | 14 | 1.4 | 25 | $707,500 | $856,667 | 99.0% |
| Sep 2026 | $751,900 | 11 | 10 | 10 | 0.9 | 20 | $770,000 | $874,982 | 99.0% |
Source: Calgary Real Estate Board (CREB®) monthly statistics. Benchmark price is the typical price of a home in the area. Median and average prices are for homes that sold in the month. Figures can be revised.
Own a home in this neighbourhood?
See what it is worth today. Get your own Owner Console from Jeff and Shirley Mikolajow: a home value update by email every month, with nearby listings in your area. Free, no obligation.
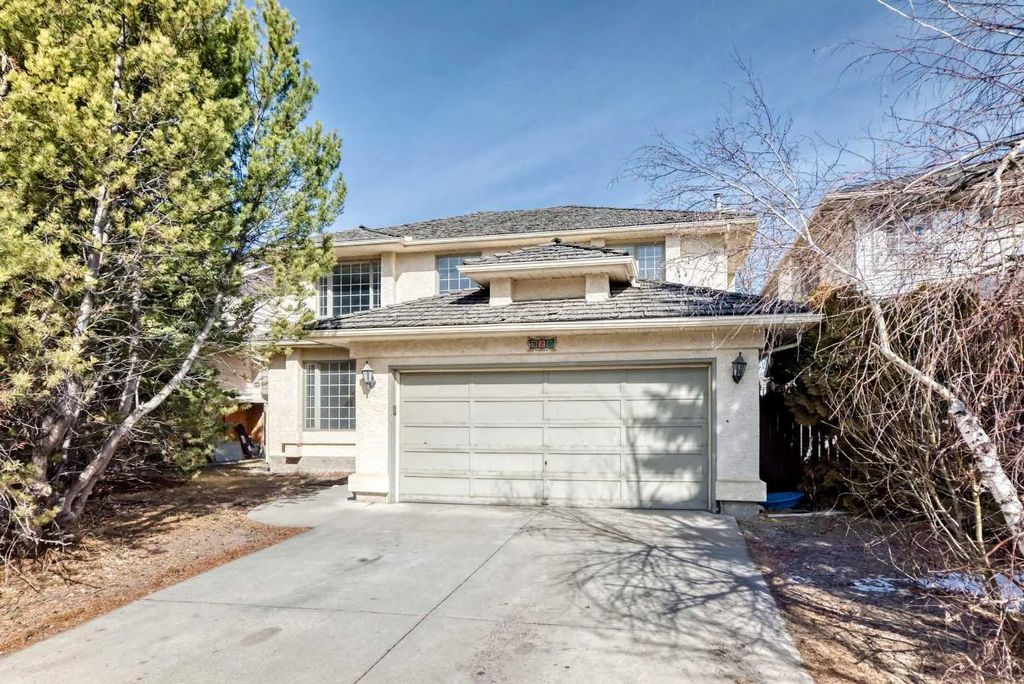
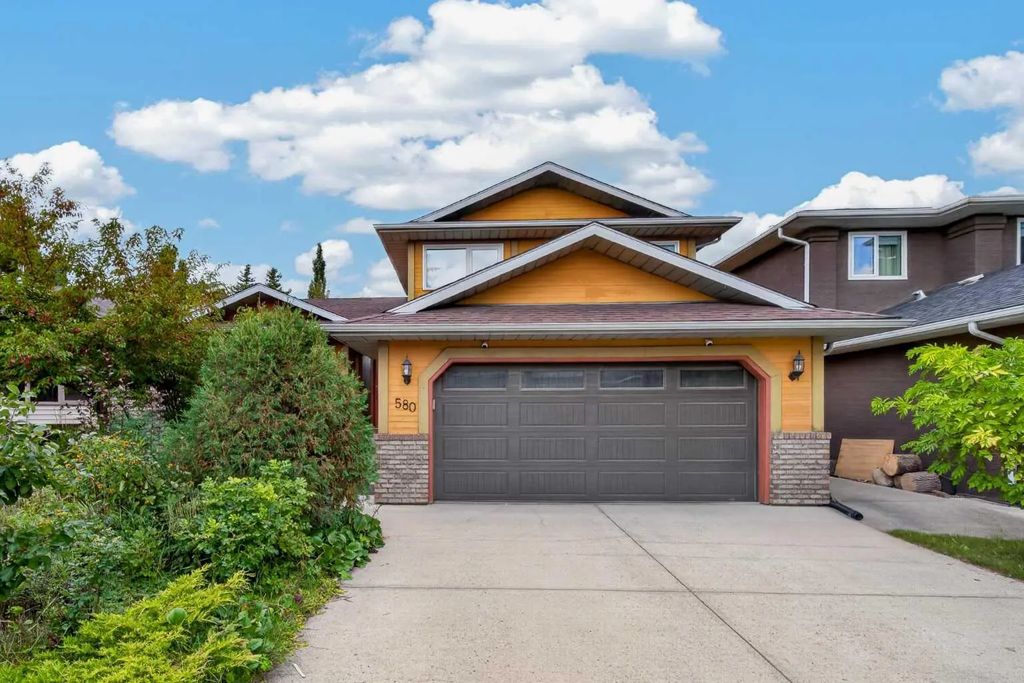
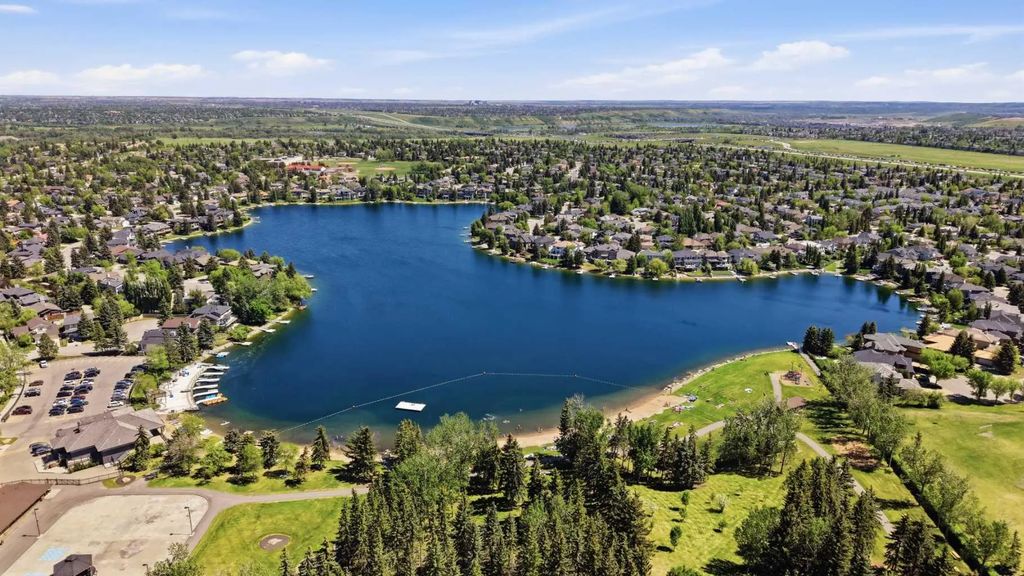
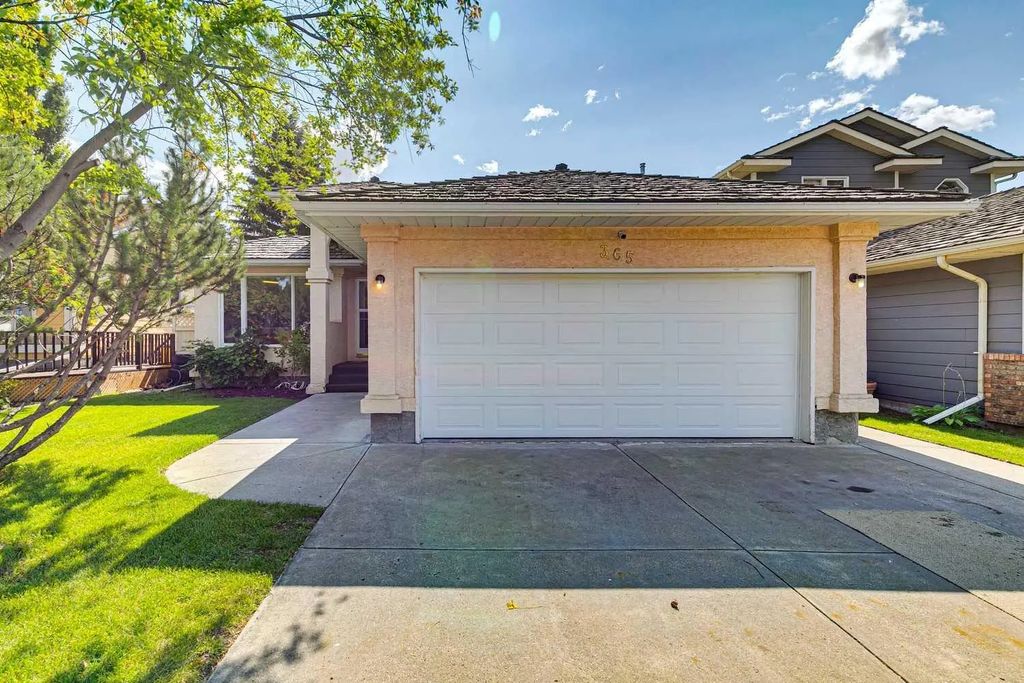
Track My Home's ValueSundance is a southeast Calgary community established in 1982, located east of Macleod Trail and bordered by Midnapore and Fish Creek Provincial Park to the north and east, with Stoney Trail forming its southern edge. The community is built around Sundance Lake, a 33-acre man-made lake at its centre; the lake is privately operated by the Sundance Lake Residents Association for resident use, similar to other south Calgary lake communities. Housing is predominantly single-family, with only a small share of condominiums, apartments, and rental units. Sundance's location next to Fish Creek Provincial Park means residents are close to the park's pathway system and to Sikome Lake, the park's public beach area. Two public elementary schools, one junior high, one public high school, and one Catholic school serve local families. With a settled housing stock dating to the 1980s, Sundance has a quieter, more established feel than newer developments further south.
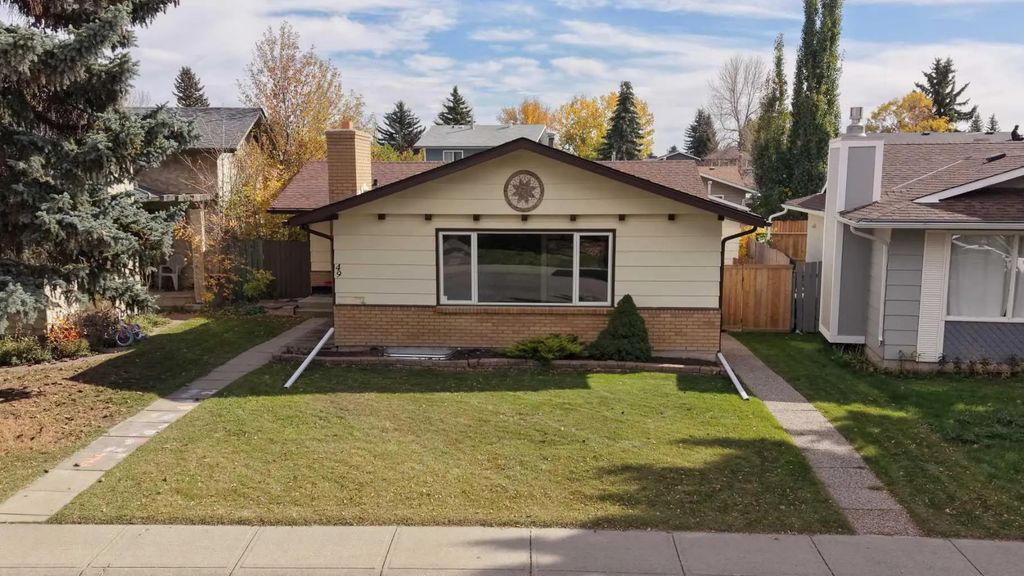
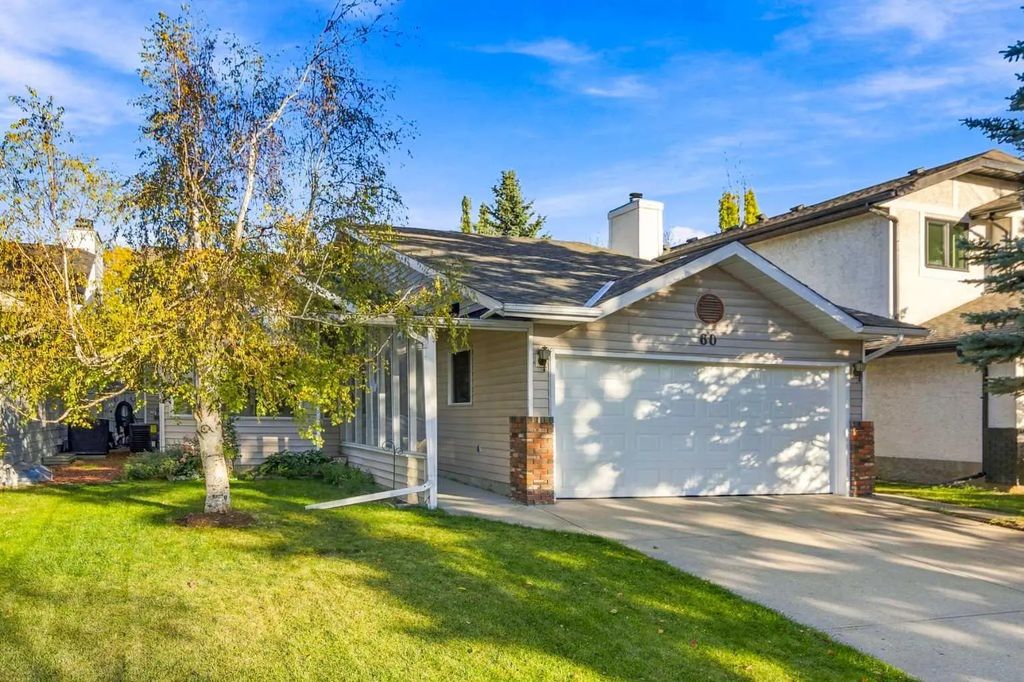
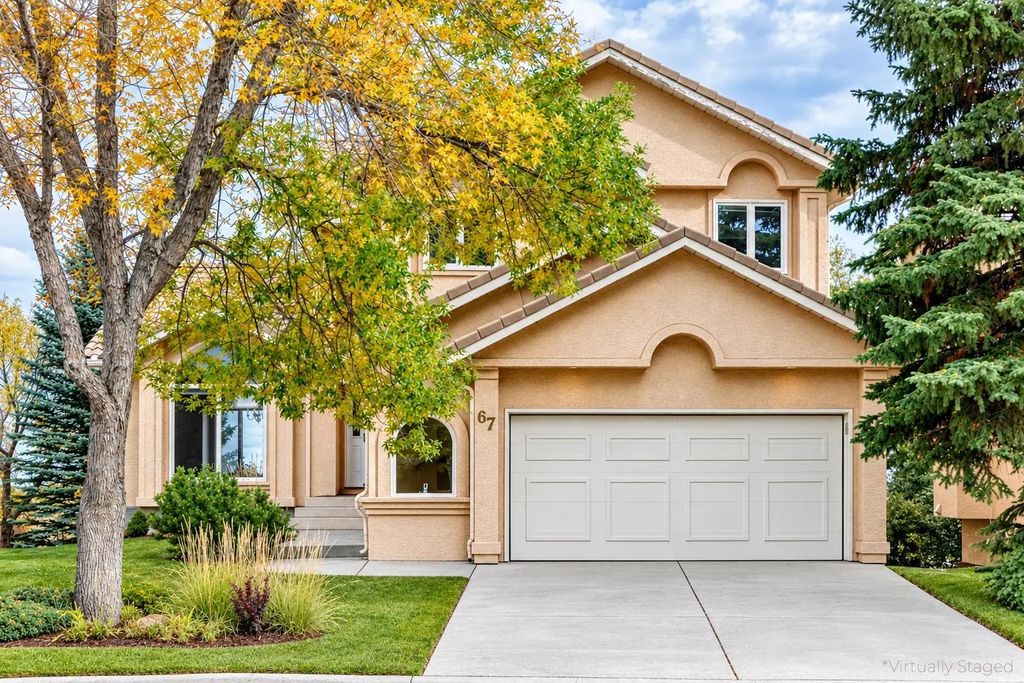
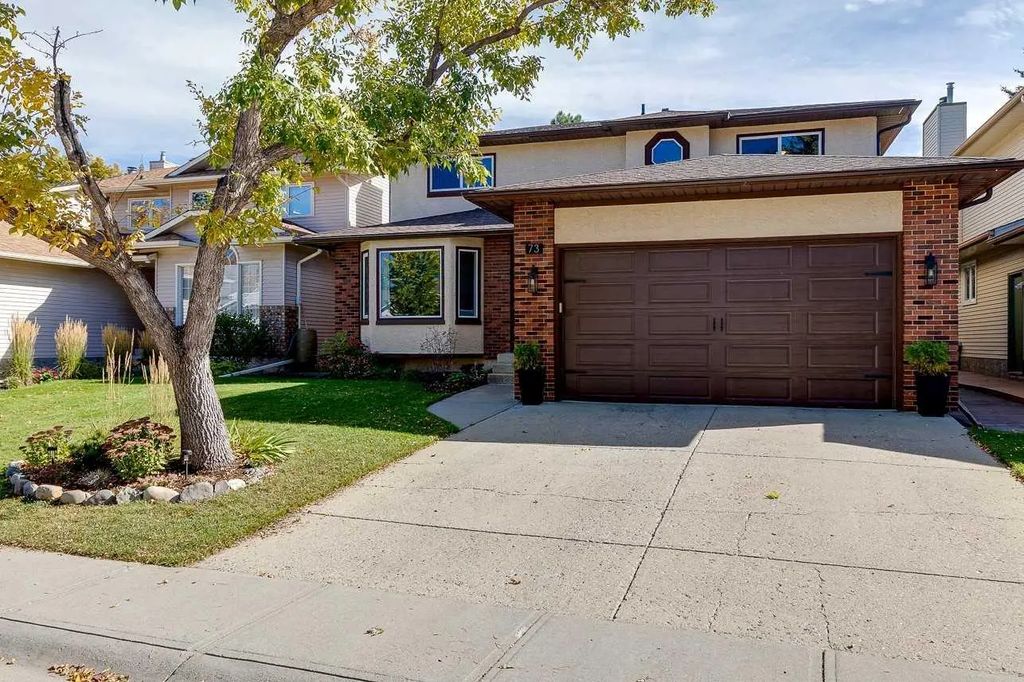
Sundance SE Calgary MLS® Listings
- All Listings
- $500,000 - $600,000
- $600,000 - $700,000
- $700,000 - $800,000
- $800,000 - $900,000
- $900,000 - $1,000,000
- Over $1,000,000


Frequently Asked Questions About Sundance
Is Sundance Lake open to the public?
No. Sundance Lake is privately managed by the Sundance Lake Residents Association for community residents, similar to other lake communities in south Calgary; the nearby Sikome Lake inside Fish Creek Provincial Park is the public beach option.
When was Sundance built?
Sundance was established in 1982, putting most of its housing stock in the 1980s, making it one of the more mature communities in this part of south Calgary.
What is Sundance’s connection to Fish Creek Provincial Park?
Sundance is bordered by Fish Creek Provincial Park to the north and east, giving residents direct access to the park’s pathway and trail network right from the community.
I’m a homeowner in Sundance. What’s the best way to track my home’s value?
The easiest way is a free Owner Console from Jeff and Shirley Mikolajow. You get a home value update by email every month, plus nearby listings in Sundance, with no cost or obligation. Get your free Owner Console.
Featured Neighbourhoods in South Calgary
- Acadia
- Bayview
- Belmont
- Bonavista Downs
- Braeside
- Bridlewood
- Canyon Meadows
- Canyon Meadows Estates
- Cedarbrae
- Chaparral
- Chinook Park
- Deer Ridge & Deer Run
- Diamond Cove
- Eagle Ridge
- Evergreen
- Evergreen Estates
- Fairview
- Haysboro
- Kelvin Grove
- Kingsland
- Lake Bonavista
- Lake Bonavista Estates
- Legacy
- Maple Ridge
- Midnapore
- Millrise
- Oakridge
- Oakridge Estates
- Palliser
- Parkland
- Pine Creek
- Pump Hill
- Queensland
- Shawnee Slopes
- Shawnessy
- Silverado
- Somerset
- Southwood
- Sundance
- Walden
- Willow Park
- Willow Park Estates
- Willow Ridge Community
- Wolf Willow
- Woodbine & Woodlands
- Yorkville
- Alpine Park