
Bayview South Calgary MLS® Listings
Houses, Condos and Real Estate For Sale by Calgary REALTORS®.
South Calgary Market Snapshot
Bayview had too few sales in September 2026 for community-level statistics, so this snapshot shows South Calgary, the district it belongs to.
September 2026 · all residential property types
In September 2026, the benchmark price for South Calgary was $569,500, down 0.3% from September last year. 328 homes sold (up 7%), 574 new listings came on the market (down 9%), and there were 1,020 active listings at month end (down 3%). Among homes that sold, the median sale price was $588,500 (up 4.9%) and the average sale price was $619,923 (up 5.7%), and homes sold for 98.0% of their asking price. That is 3.1 months of supply, and homes spent 39 days on the market (up 3 days). Figures cover all residential property types.
View the numbers
| Measure | September 2026 | September last year |
|---|---|---|
| Benchmark price | $569,500 | $571,100 |
| Median price | $588,500 | $561,250 |
| Average price | $619,923 | $586,701 |
| Sold vs asking | 98.0% | 98.0% |
| Homes sold | 328 | 306 |
| New listings | 574 | 631 |
| Active listings | 1,020 | 1,049 |
| Months of supply | 3.1 | 3.4 |
| Days on market | 39 | 36 |
ShowHide 12-month trend
View the monthly numbers
| Month | Benchmark price | Sold | New listings | Active listings | Months of supply | Days on market | Median price | Average price | Sold vs asking |
|---|---|---|---|---|---|---|---|---|---|
| Oct 2025 | $565,800 | 378 | 543 | 966 | 2.6 | 42 | $585,250 | $606,944 | 98.0% |
| Nov 2025 | $558,500 | 284 | 375 | 829 | 2.9 | 44 | $575,000 | $602,813 | 98.0% |
| Dec 2025 | $556,500 | 201 | 189 | 558 | 2.8 | 49 | $580,000 | $610,125 | 98.0% |
| Jan 2026 | $555,800 | 222 | 427 | 632 | 2.9 | 46 | $562,500 | $586,149 | 98.0% |
| Feb 2026 | $559,000 | 291 | 416 | 656 | 2.3 | 37 | $575,000 | $590,375 | 98.0% |
| Mar 2026 | $568,200 | 351 | 572 | 764 | 2.2 | 32 | $595,500 | $622,096 | 99.0% |
| Apr 2026 | $574,200 | 424 | 705 | 892 | 2.1 | 32 | $615,750 | $626,967 | 99.0% |
| May 2026 | $575,800 | 416 | 699 | 976 | 2.4 | 31 | $623,500 | $661,462 | 99.0% |
| Jun 2026 | $579,400 | 397 | 638 | 991 | 2.5 | 33 | $600,000 | $643,828 | 98.0% |
| Jul 2026 | $577,000 | 353 | 559 | 966 | 2.7 | 35 | $600,000 | $620,656 | 98.0% |
| Aug 2026 | $573,500 | 297 | 547 | 1003 | 3.4 | 36 | $590,000 | $610,296 | 98.0% |
| Sep 2026 | $569,500 | 328 | 574 | 1020 | 3.1 | 39 | $588,500 | $619,923 | 98.0% |
September 2026 · detached homes
In September 2026, the benchmark price for South Calgary was $709,400, down 0.8% from September last year. 202 homes sold (up 21%), 361 new listings came on the market (down 4%), and there were 555 active listings at month end (down 6%). Among homes that sold, the median sale price was $681,750 (up 0.9%) and the average sale price was $769,156 (up 4.1%), and homes sold for 98.0% of their asking price. That is 2.8 months of supply, and homes spent 35 days on the market (up 1 days). Figures cover detached homes.
View the numbers
| Measure | September 2026 | September last year |
|---|---|---|
| Benchmark price | $709,400 | $715,300 |
| Median price | $681,750 | $676,000 |
| Average price | $769,156 | $738,900 |
| Sold vs asking | 98.0% | 99.0% |
| Homes sold | 202 | 167 |
| New listings | 361 | 376 |
| Active listings | 555 | 592 |
| Months of supply | 2.8 | 3.5 |
| Days on market | 35 | 34 |
ShowHide 12-month trend
View the monthly numbers
| Month | Benchmark price | Sold | New listings | Active listings | Months of supply | Days on market | Median price | Average price | Sold vs asking |
|---|---|---|---|---|---|---|---|---|---|
| Oct 2025 | $710,200 | 225 | 312 | 534 | 2.4 | 36 | $678,000 | $746,273 | 98.0% |
| Nov 2025 | $700,700 | 168 | 212 | 454 | 2.7 | 39 | $690,000 | $730,944 | 98.0% |
| Dec 2025 | $698,200 | 125 | 115 | 282 | 2.3 | 47 | $653,000 | $756,385 | 98.0% |
| Jan 2026 | $698,100 | 133 | 227 | 308 | 2.3 | 43 | $687,500 | $721,477 | 98.0% |
| Feb 2026 | $702,500 | 156 | 235 | 334 | 2.1 | 36 | $690,000 | $729,889 | 99.0% |
| Mar 2026 | $714,000 | 222 | 342 | 393 | 1.8 | 28 | $695,500 | $754,350 | 99.0% |
| Apr 2026 | $720,600 | 259 | 395 | 456 | 1.8 | 28 | $700,000 | $772,260 | 99.0% |
| May 2026 | $721,500 | 278 | 431 | 513 | 1.9 | 26 | $711,000 | $785,292 | 99.0% |
| Jun 2026 | $724,100 | 243 | 380 | 523 | 2.2 | 28 | $710,000 | $806,888 | 99.0% |
| Jul 2026 | $719,500 | 218 | 344 | 509 | 2.3 | 29 | $687,250 | $769,854 | 98.0% |
| Aug 2026 | $715,200 | 178 | 321 | 530 | 3.0 | 30 | $677,500 | $762,324 | 98.0% |
| Sep 2026 | $709,400 | 202 | 361 | 555 | 2.8 | 35 | $681,750 | $769,156 | 98.0% |
September 2026 · semi-detached homes
In September 2026, the benchmark price for South Calgary was $524,400, down 1.4% from September last year. 32 homes sold (up 68%), 49 new listings came on the market (down 2%), and there were 80 active listings at month end (down 4%). Among homes that sold, the median sale price was $512,875 (down 9.4%) and the average sale price was $550,109 (down 1.7%), and homes sold for 98.0% of their asking price. That is 2.5 months of supply, and homes spent 36 days on the market (up 5 days). Figures cover semi-detached homes.
View the numbers
| Measure | September 2026 | September last year |
|---|---|---|
| Benchmark price | $524,400 | $531,700 |
| Median price | $512,875 | $566,000 |
| Average price | $550,109 | $559,738 |
| Sold vs asking | 98.0% | 99.0% |
| Homes sold | 32 | 19 |
| New listings | 49 | 50 |
| Active listings | 80 | 83 |
| Months of supply | 2.5 | 4.4 |
| Days on market | 36 | 31 |
ShowHide 12-month trend
View the monthly numbers
| Month | Benchmark price | Sold | New listings | Active listings | Months of supply | Days on market | Median price | Average price | Sold vs asking |
|---|---|---|---|---|---|---|---|---|---|
| Oct 2025 | $530,600 | 29 | 57 | 96 | 3.3 | 33 | $560,000 | $559,026 | 98.0% |
| Nov 2025 | $523,200 | 32 | 35 | 76 | 2.4 | 52 | $549,225 | $545,716 | 98.0% |
| Dec 2025 | $518,200 | 15 | 12 | 51 | 3.4 | 46 | $521,990 | $501,713 | 99.0% |
| Jan 2026 | $522,000 | 16 | 40 | 65 | 4.1 | 47 | $510,500 | $496,312 | 98.0% |
| Feb 2026 | $522,100 | 33 | 33 | 54 | 1.6 | 41 | $555,000 | $582,986 | 97.0% |
| Mar 2026 | $528,400 | 24 | 48 | 73 | 3.0 | 55 | $537,500 | $545,156 | 98.0% |
| Apr 2026 | $536,400 | 44 | 58 | 75 | 1.7 | 38 | $530,500 | $549,447 | 99.0% |
| May 2026 | $536,100 | 31 | 54 | 79 | 2.6 | 39 | $525,000 | $561,016 | 98.0% |
| Jun 2026 | $534,900 | 32 | 43 | 77 | 2.4 | 31 | $520,000 | $505,289 | 98.0% |
| Jul 2026 | $529,800 | 28 | 38 | 72 | 2.6 | 43 | $541,875 | $569,285 | 98.0% |
| Aug 2026 | $529,400 | 20 | 38 | 74 | 3.7 | 52 | $539,750 | $582,132 | 98.0% |
| Sep 2026 | $524,400 | 32 | 49 | 80 | 2.5 | 36 | $512,875 | $550,109 | 98.0% |
September 2026 · row and townhouse homes
In September 2026, the benchmark price for South Calgary was $369,200, down 5.3% from September last year. 50 homes sold (down 35%), 87 new listings came on the market (unchanged), and there were 182 active listings at month end (up 29%). Among homes that sold, the median sale price was $380,000 (down 7.7%) and the average sale price was $371,328 (down 10.2%), and homes sold for 97.0% of their asking price. That is 3.6 months of supply, and homes spent 47 days on the market (up 6 days). Figures cover row and townhouse homes.
View the numbers
| Measure | September 2026 | September last year |
|---|---|---|
| Benchmark price | $369,200 | $389,800 |
| Median price | $380,000 | $411,500 |
| Average price | $371,328 | $413,290 |
| Sold vs asking | 97.0% | 98.0% |
| Homes sold | 50 | 77 |
| New listings | 87 | 87 |
| Active listings | 182 | 141 |
| Months of supply | 3.6 | 1.8 |
| Days on market | 47 | 41 |
ShowHide 12-month trend
View the monthly numbers
| Month | Benchmark price | Sold | New listings | Active listings | Months of supply | Days on market | Median price | Average price | Sold vs asking |
|---|---|---|---|---|---|---|---|---|---|
| Oct 2025 | $382,900 | 63 | 85 | 129 | 2.1 | 61 | $415,000 | $429,456 | 97.0% |
| Nov 2025 | $380,300 | 44 | 57 | 111 | 2.5 | 55 | $399,750 | $401,949 | 97.0% |
| Dec 2025 | $381,200 | 26 | 28 | 87 | 3.4 | 51 | $407,500 | $411,950 | 97.0% |
| Jan 2026 | $377,000 | 32 | 69 | 100 | 3.1 | 47 | $433,750 | $417,587 | 98.0% |
| Feb 2026 | $382,000 | 53 | 64 | 99 | 1.9 | 40 | $435,000 | $419,240 | 98.0% |
| Mar 2026 | $387,000 | 58 | 87 | 115 | 2.0 | 31 | $407,500 | $415,666 | 99.0% |
| Apr 2026 | $390,200 | 57 | 113 | 147 | 2.6 | 36 | $421,000 | $421,258 | 99.0% |
| May 2026 | $387,400 | 62 | 100 | 154 | 2.5 | 31 | $408,750 | $409,607 | 98.0% |
| Jun 2026 | $391,000 | 66 | 95 | 153 | 2.3 | 38 | $414,250 | $416,008 | 98.0% |
| Jul 2026 | $383,400 | 52 | 82 | 153 | 2.9 | 43 | $392,600 | $385,007 | 98.0% |
| Aug 2026 | $376,400 | 49 | 98 | 172 | 3.5 | 39 | $409,359 | $416,628 | 98.0% |
| Sep 2026 | $369,200 | 50 | 87 | 182 | 3.6 | 47 | $380,000 | $371,328 | 97.0% |
September 2026 · apartment condos
In September 2026, the benchmark price for South Calgary was $271,900, down 9.2% from September last year. 44 homes sold (up 2%), 77 new listings came on the market (down 35%), and there were 203 active listings at month end (down 13%). Among homes that sold, the median sale price was $263,500 (down 14.7%) and the average sale price was $268,080 (down 15.7%), and homes sold for 96.0% of their asking price. That is 4.6 months of supply, and homes spent 53 days on the market (up 11 days). Figures cover apartment condos.
View the numbers
| Measure | September 2026 | September last year |
|---|---|---|
| Benchmark price | $271,900 | $299,500 |
| Median price | $263,500 | $309,000 |
| Average price | $268,080 | $318,047 |
| Sold vs asking | 96.0% | 97.0% |
| Homes sold | 44 | 43 |
| New listings | 77 | 118 |
| Active listings | 203 | 233 |
| Months of supply | 4.6 | 5.4 |
| Days on market | 53 | 42 |
ShowHide 12-month trend
View the monthly numbers
| Month | Benchmark price | Sold | New listings | Active listings | Months of supply | Days on market | Median price | Average price | Sold vs asking |
|---|---|---|---|---|---|---|---|---|---|
| Oct 2025 | $294,400 | 61 | 89 | 207 | 3.4 | 51 | $285,000 | $299,111 | 97.0% |
| Nov 2025 | $290,500 | 40 | 71 | 188 | 4.7 | 46 | $275,000 | $331,294 | 97.0% |
| Dec 2025 | $284,800 | 35 | 34 | 138 | 3.9 | 57 | $250,000 | $281,444 | 97.0% |
| Jan 2026 | $280,400 | 41 | 91 | 159 | 3.9 | 53 | $283,700 | $313,774 | 96.0% |
| Feb 2026 | $279,500 | 49 | 84 | 169 | 3.5 | 33 | $286,500 | $336,290 | 96.0% |
| Mar 2026 | $279,900 | 47 | 95 | 183 | 3.9 | 43 | $275,000 | $291,443 | 98.0% |
| Apr 2026 | $280,000 | 64 | 139 | 214 | 3.3 | 39 | $262,500 | $275,491 | 98.0% |
| May 2026 | $280,200 | 45 | 114 | 230 | 5.1 | 56 | $262,000 | $312,662 | 97.0% |
| Jun 2026 | $277,200 | 56 | 120 | 238 | 4.3 | 49 | $263,000 | $283,931 | 96.0% |
| Jul 2026 | $277,000 | 55 | 95 | 232 | 4.2 | 50 | $245,000 | $278,238 | 96.0% |
| Aug 2026 | $274,700 | 50 | 90 | 227 | 4.5 | 48 | $258,125 | $270,139 | 97.0% |
| Sep 2026 | $271,900 | 44 | 77 | 203 | 4.6 | 53 | $263,500 | $268,080 | 96.0% |
Source: Calgary Real Estate Board (CREB®) monthly statistics. Benchmark price is the typical price of a home in the area. Median and average prices are for homes that sold in the month. Figures can be revised.
Own a home in this neighbourhood?
See what it is worth today. Get your own Owner Console from Jeff and Shirley Mikolajow: a home value update by email every month, with nearby listings in your area. Free, no obligation.
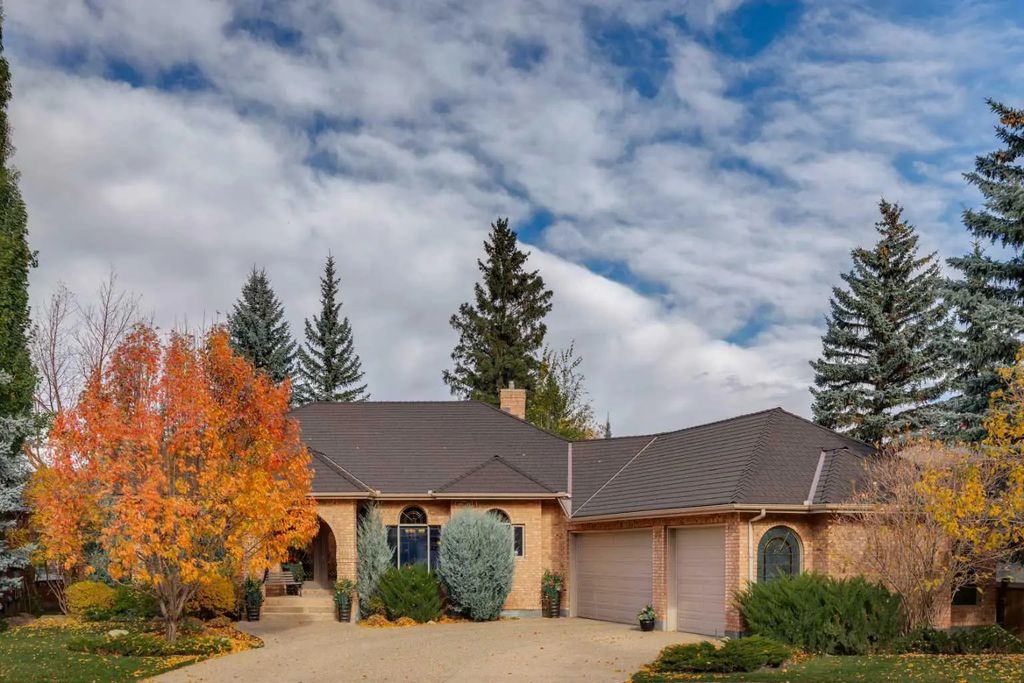
Track My Home's ValueBayview is a small, exclusive community in southwest Calgary, established in 1967 on a peninsula along the south shore of the Glenmore Reservoir. At under half a square kilometre, it is one of the smallest communities in the city, built entirely with single-family detached homes by original developer Alcan Design Homes in American Colonial, Spanish, Tudor, and Modern styles. Every home has a front attached garage and there are no laneways. Bayview borders Glenmore Landing, a shopping plaza with grocery, retail, and dining options, and is home to one of the reservoir's two marinas, giving residents direct water access for sailing and paddling. The community has consistently ranked among Calgary's higher-income neighbourhoods. Nellie McClung Elementary, John Ware Junior High, and St. Benedict Catholic Elementary serve the area from nearby communities. Its low density and reservoir frontage distinguish it from busier surrounding southwest neighbourhoods.
Bayview Homes For Sale
- All Listings
- Over $1,000,000
Frequently Asked Questions About Bayview
When was Bayview established?
Bayview was established in 1967 on a peninsula along the south shore of the Glenmore Reservoir in southwest Calgary.
What type of housing is in Bayview?
Bayview consists exclusively of single-family detached homes with front attached garages, built by original developer Alcan Design Homes in several architectural styles.
Is Bayview close to the water?
Yes, Bayview borders the Glenmore Reservoir directly and is home to one of the reservoir’s two marinas.
I’m a homeowner in South Calgary. What’s the best way to track my home’s value?
The easiest way is a free Owner Console from Jeff and Shirley Mikolajow. You get a home value update by email every month, plus nearby listings in South Calgary, with no cost or obligation. Get your free Owner Console.
Featured Neighbourhoods in South Calgary
- Acadia
- Bayview
- Belmont
- Bonavista Downs
- Braeside
- Bridlewood
- Canyon Meadows
- Canyon Meadows Estates
- Cedarbrae
- Chaparral
- Chinook Park
- Deer Ridge & Deer Run
- Diamond Cove
- Eagle Ridge
- Evergreen
- Evergreen Estates
- Fairview
- Haysboro
- Kelvin Grove
- Kingsland
- Lake Bonavista
- Lake Bonavista Estates
- Legacy
- Maple Ridge
- Midnapore
- Millrise
- Oakridge
- Oakridge Estates
- Palliser
- Parkland
- Pine Creek
- Pump Hill
- Queensland
- Shawnee Slopes
- Shawnessy
- Silverado
- Somerset
- Southwood
- Sundance
- Walden
- Willow Park
- Willow Park Estates
- Willow Ridge Community
- Wolf Willow
- Woodbine & Woodlands
- Yorkville
- Alpine Park