
South Calgary City Centre Calgary MLS® Listings
Houses, Condos and Real Estate For Sale by Calgary REALTORS®.
South Calgary Market Snapshot
September 2026 · all residential property types
In September 2026, the benchmark price for South Calgary was $659,900, up 2.4% from September last year. 6 homes sold (down 33%), 25 new listings came on the market (up 4%), and there were 51 active listings at month end (up 13%). Among homes that sold, the median sale price was $877,500 (up 30.2%) and the average sale price was $772,500 (up 13.1%), and homes sold for 96.0% of their asking price. That is 8.5 months of supply, and homes spent 57 days on the market (up 24 days). Figures cover all residential property types.
View the numbers
| Measure | September 2026 | September last year |
|---|---|---|
| Benchmark price | $659,900 | $644,400 |
| Median price | $877,500 | $673,800 |
| Average price | $772,500 | $682,756 |
| Sold vs asking | 96.0% | 98.0% |
| Homes sold | 6 | 9 |
| New listings | 25 | 24 |
| Active listings | 51 | 45 |
| Months of supply | 8.5 | 5.0 |
| Days on market | 57 | 33 |
12-month trend
View the monthly numbers
| Month | Benchmark price | Sold | New listings | Active listings | Months of supply | Days on market | Median price | Average price | Sold vs asking |
|---|---|---|---|---|---|---|---|---|---|
| Oct 2025 | $661,200 | 12 | 25 | 43 | 3.6 | 47 | $555,500 | $796,019 | 97.0% |
| Nov 2025 | $629,600 | 10 | 10 | 32 | 3.2 | 58 | $646,915 | $656,273 | 96.0% |
| Dec 2025 | $622,500 | 8 | 6 | 19 | 2.4 | 48 | $700,000 | $749,125 | 97.0% |
| Jan 2026 | $633,800 | 5 | 14 | 21 | 4.2 | 43 | $354,500 | $408,466 | 98.0% |
| Feb 2026 | $641,700 | 6 | 19 | 29 | 4.8 | 19 | $467,750 | $540,417 | 98.0% |
| Mar 2026 | $650,800 | 10 | 28 | 42 | 4.2 | 44 | $679,000 | $805,550 | 98.0% |
| Apr 2026 | $649,700 | 12 | 21 | 46 | 3.8 | 26 | $864,500 | $1,040,059 | 98.0% |
| May 2026 | $653,900 | 18 | 26 | 49 | 2.7 | 30 | $387,500 | $726,186 | 100.0% |
| Jun 2026 | $660,300 | 12 | 21 | 48 | 4.0 | 56 | $599,500 | $709,125 | 98.0% |
| Jul 2026 | $661,900 | 12 | 24 | 48 | 4.0 | 23 | $770,500 | $868,404 | 100.0% |
| Aug 2026 | $661,200 | 11 | 16 | 39 | 3.6 | 56 | $610,000 | $649,591 | 97.0% |
| Sep 2026 | $659,900 | 6 | 25 | 51 | 8.5 | 57 | $877,500 | $772,500 | 96.0% |
September 2026 · semi-detached homes
In September 2026, the benchmark price for South Calgary was $1,037,500, up 0.9% from September last year. 3 homes sold (up 50%), 5 new listings came on the market (down 17%), and there were 14 active listings at month end (up 40%). Among homes that sold, the median sale price was $1,100,000 (up 7.3%) and the average sale price was $1,128,333 (up 10.1%), and homes sold for 96.0% of their asking price. That is 4.7 months of supply, and homes spent 62 days on the market (up 45 days). Figures cover semi-detached homes.
View the numbers
| Measure | September 2026 | September last year |
|---|---|---|
| Benchmark price | $1,037,500 | $1,028,600 |
| Median price | $1,100,000 | $1,025,000 |
| Average price | $1,128,333 | $1,025,000 |
| Sold vs asking | 96.0% | 99.0% |
| Homes sold | 3 | 2 |
| New listings | 5 | 6 |
| Active listings | 14 | 10 |
| Months of supply | 4.7 | 5.0 |
| Days on market | 62 | 17 |
12-month trend
View the monthly numbers
| Month | Benchmark price | Sold | New listings | Active listings | Months of supply | Days on market | Median price | Average price | Sold vs asking |
|---|---|---|---|---|---|---|---|---|---|
| Oct 2025 | $1,055,200 | 1 | 5 | 12 | 12.0 | 39 | $963,225 | $963,225 | 96.0% |
| Nov 2025 | $1,006,700 | 3 | 1 | 7 | 2.3 | 66 | $833,500 | $900,500 | 96.0% |
| Dec 2025 | $988,600 | 2 | 1 | 4 | 2.0 | 32 | $808,500 | $808,500 | 98.0% |
| Jan 2026 | $1,010,700 | 0 | 0 | 3 | n/a | n/a | n/a | n/a | n/a |
| Feb 2026 | $1,021,700 | 1 | 7 | 6 | 6.0 | 8 | $1,200,000 | $1,200,000 | 101.0% |
| Mar 2026 | $1,055,700 | 3 | 8 | 10 | 3.3 | 18 | $870,000 | $1,046,000 | 99.0% |
| Apr 2026 | $1,047,100 | 3 | 4 | 10 | 3.3 | 16 | $1,073,500 | $1,042,700 | 99.0% |
| May 2026 | $1,041,900 | 4 | 5 | 11 | 2.8 | 33 | $909,300 | $962,900 | 98.0% |
| Jun 2026 | $1,049,700 | 3 | 6 | 13 | 4.3 | 52 | $1,410,000 | $1,384,000 | 99.0% |
| Jul 2026 | $1,041,100 | 3 | 5 | 12 | 4.0 | 17 | $771,000 | $892,000 | 101.0% |
| Aug 2026 | $1,025,600 | 4 | 8 | 13 | 3.3 | 36 | $880,000 | $807,500 | 98.0% |
| Sep 2026 | $1,037,500 | 3 | 5 | 14 | 4.7 | 62 | $1,100,000 | $1,128,333 | 96.0% |
Source: Calgary Real Estate Board (CREB®) monthly statistics. Benchmark price is the typical price of a home in the area. Median and average prices are for homes that sold in the month. Figures can be revised.
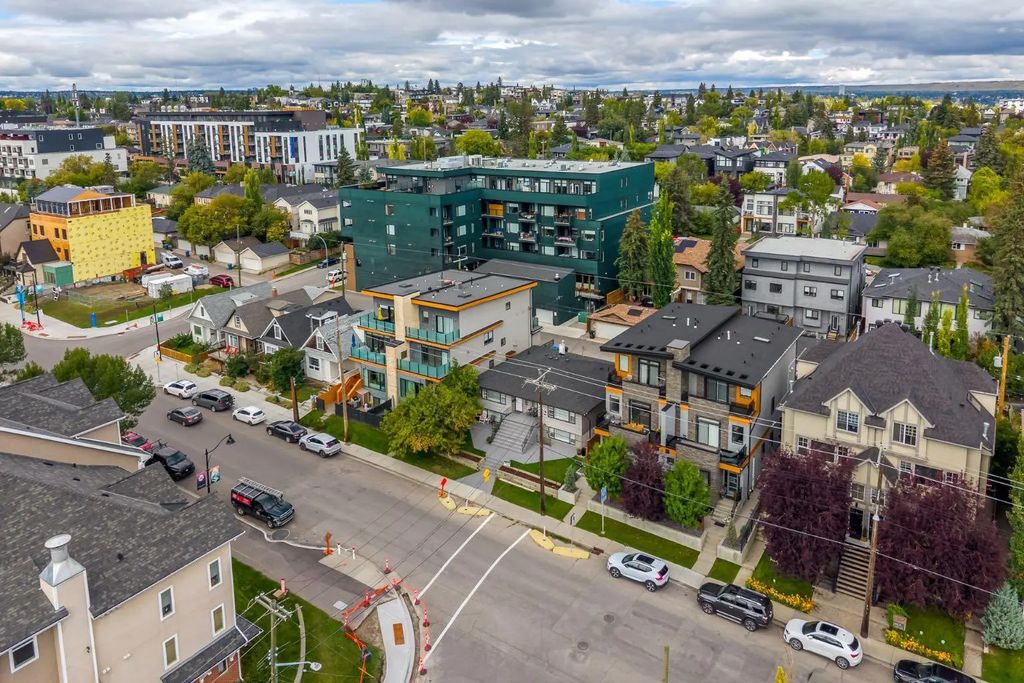
South Calgary is a small, established inner-city community in southwest Calgary, bounded roughly by Crowchild Trail, 14th Street SW, and Elbow Drive, centred near 33rd and 34th Avenue SW next to the Marda Loop shopping district. The land was annexed to the city in 1907 and the community was formally established in 1914, though it remained largely undeveloped until the postwar building boom of the 1950s. It's important to note that this small community named South Calgary is not the same as the much broader "South Calgary" district or quadrant label some real estate sites use to group dozens of unrelated communities in the far south of the city, such as Willow Park, Woodbine, and Somerset; those neighbourhoods sit many kilometres away near Calgary's southern edge. The inner-city South Calgary shares an area redevelopment plan with neighbouring Altadore and offers an outdoor pool, community hall, and the Giuffre Family Library.
- All Listings
- Under $100,000
- $100,000 - $200,000
- $200,000 - $300,000
- $300,000 - $400,000
- $500,000 - $600,000
- $600,000 - $700,000
- $700,000 - $800,000
- $800,000 - $900,000
- $900,000 - $1,000,000
- Over $1,000,000






Sign Up For A Free Calgary Real Estate Market Report!
Be a smart homeowner. Whether you are looking to buy or looking to sell, knowing your market makes a difference in your pocket. By signing up, you will receive a customized report, every month. This report gives you a 12-month summary with exclusive insights into Calgary real estate and your neighbourhood of choice.
The power of this report gives you special insights into information like average and median prices. Get to know what has sold and at what price in your neighborhood, and see where they are on Google Maps!
Get Your Free Market ReportFrequently Asked Questions About South Calgary
Is South Calgary the same as the South Calgary district or quadrant?
No. This is a specific, small inner-city community bounded by Crowchild Trail, 14th Street SW, and Elbow Drive near Marda Loop. Some sites also use "South Calgary" as an umbrella label for a much larger group of communities in the far south of the city, such as Willow Park and Woodbine — those are unrelated areas many kilometres away and not part of this community.
When was South Calgary established?
The land was annexed to Calgary in 1907, and South Calgary was formally established as a community in 1914, with most of its homes built during the 1950s postwar boom.
What is South Calgary known for?
It's known for its location beside the Marda Loop shopping and dining district, walkable tree-lined streets, an outdoor pool, and a community hall, shared under the South Calgary-Altadore Area Redevelopment Plan.
Featured Neighbourhoods in City Centre Calgary
- Altadore
- Bankview
- Banff Trail
- Bel-Aire
- Beltline
- Bridgeland/Riverside
- Britannia
- Cambrian Heights
- Capitol Hill
- Chinatown
- Cliff Bungalow
- Connaught
- Crescent Heights
- Downtown Core
- Downtown East Village
- Downtown West End
- Eau Claire
- Elbow Park
- Elboya
- Erlton
- Garrison Woods
- Greenview
- Highland Park
- Highwood
- Hillhurst
- Hounsfield Heights/Briar Hill
- Inglewood
- Killarney/Glengarry
- Lower Mount Royal
- Marda Loop
- Mayfair
- Meadowlark Park
- Mission
- Mount Pleasant
- Upper Mount Royal
- Parkdale
- Parkhill
- Point McKay
- Queens Park Village
- Ramsay
- Renfrew
- Richmond
- Rideau Park
- Rosedale
- Rosemont
- Roxboro
- Scarboro
- Shaganappi
- Signature Parke
- South Calgary
- St. Andrews Heights
- Sunalta
- Sunnyside
- Tuxedo Park
- Victoria Park
- West Hillhurst
- Windsor Park
- Winston Heights/Mountview