
Rosedale City Centre Calgary MLS® Listings
Houses, Condos and Real Estate For Sale by Calgary REALTORS®.
City Centre Market Snapshot
Rosedale had too few sales in September 2026 for community-level statistics, so this snapshot shows City Centre, the district it belongs to.
September 2026 · all residential property types
In September 2026, the benchmark price for City Centre was $573,100, up 0.2% from September last year. 332 homes sold (down 4%), 740 new listings came on the market (down 6%), and there were 1,523 active listings at month end (unchanged). Among homes that sold, the median sale price was $596,000 (up 11.2%) and the average sale price was $786,119 (up 17.5%), and homes sold for 97.0% of their asking price. That is 4.6 months of supply, and homes spent 46 days on the market (up 1 days). Figures cover all residential property types.
View the numbers
| Measure | September 2026 | September last year |
|---|---|---|
| Benchmark price | $573,100 | $572,100 |
| Median price | $596,000 | $535,775 |
| Average price | $786,119 | $668,960 |
| Sold vs asking | 97.0% | 98.0% |
| Homes sold | 332 | 346 |
| New listings | 740 | 788 |
| Active listings | 1,523 | 1,520 |
| Months of supply | 4.6 | 4.4 |
| Days on market | 46 | 45 |
12-month trend
View the monthly numbers
| Month | Benchmark price | Sold | New listings | Active listings | Months of supply | Days on market | Median price | Average price | Sold vs asking |
|---|---|---|---|---|---|---|---|---|---|
| Oct 2025 | $567,100 | 369 | 667 | 1441 | 3.9 | 42 | $615,000 | $765,975 | 97.0% |
| Nov 2025 | $557,100 | 297 | 453 | 1283 | 4.3 | 53 | $555,000 | $684,361 | 97.0% |
| Dec 2025 | $554,500 | 227 | 233 | 857 | 3.8 | 57 | $515,000 | $656,339 | 96.0% |
| Jan 2026 | $552,700 | 227 | 620 | 1027 | 4.5 | 57 | $477,500 | $744,584 | 97.0% |
| Feb 2026 | $563,900 | 306 | 597 | 1118 | 3.7 | 45 | $589,950 | $768,383 | 97.0% |
| Mar 2026 | $564,200 | 383 | 746 | 1267 | 3.3 | 38 | $580,000 | $714,458 | 98.0% |
| Apr 2026 | $568,200 | 395 | 755 | 1389 | 3.5 | 38 | $580,000 | $751,871 | 98.0% |
| May 2026 | $568,800 | 396 | 854 | 1565 | 4.0 | 35 | $612,750 | $785,282 | 98.0% |
| Jun 2026 | $577,000 | 417 | 809 | 1568 | 3.8 | 36 | $608,000 | $782,901 | 98.0% |
| Jul 2026 | $576,200 | 344 | 649 | 1521 | 4.4 | 44 | $557,500 | $709,671 | 97.0% |
| Aug 2026 | $580,000 | 279 | 641 | 1511 | 5.4 | 44 | $640,000 | $782,881 | 97.0% |
| Sep 2026 | $573,100 | 332 | 740 | 1523 | 4.6 | 46 | $596,000 | $786,119 | 97.0% |
September 2026 · detached homes
In September 2026, the benchmark price for City Centre was $981,300, up 0.7% from September last year. 106 homes sold (up 16%), 200 new listings came on the market (down 8%), and there were 372 active listings at month end (down 3%). Among homes that sold, the median sale price was $1,025,000 (up 14.1%) and the average sale price was $1,377,229 (up 23.4%), and homes sold for 98.0% of their asking price. That is 3.5 months of supply, and homes spent 37 days on the market (down 6 days). Figures cover detached homes.
View the numbers
| Measure | September 2026 | September last year |
|---|---|---|
| Benchmark price | $981,300 | $974,300 |
| Median price | $1,025,000 | $898,000 |
| Average price | $1,377,229 | $1,116,190 |
| Sold vs asking | 98.0% | 98.0% |
| Homes sold | 106 | 91 |
| New listings | 200 | 217 |
| Active listings | 372 | 385 |
| Months of supply | 3.5 | 4.2 |
| Days on market | 37 | 43 |
12-month trend
View the monthly numbers
| Month | Benchmark price | Sold | New listings | Active listings | Months of supply | Days on market | Median price | Average price | Sold vs asking |
|---|---|---|---|---|---|---|---|---|---|
| Oct 2025 | $960,900 | 124 | 173 | 342 | 2.8 | 32 | $953,000 | $1,287,451 | 97.0% |
| Nov 2025 | $944,500 | 85 | 122 | 301 | 3.5 | 46 | $865,000 | $1,063,462 | 97.0% |
| Dec 2025 | $946,800 | 58 | 50 | 197 | 3.4 | 59 | $892,500 | $1,127,018 | 96.0% |
| Jan 2026 | $932,300 | 72 | 159 | 233 | 3.2 | 44 | $970,700 | $1,317,808 | 98.0% |
| Feb 2026 | $967,800 | 86 | 145 | 252 | 2.9 | 30 | $1,082,500 | $1,371,516 | 99.0% |
| Mar 2026 | $964,700 | 99 | 177 | 282 | 2.9 | 33 | $965,000 | $1,203,285 | 99.0% |
| Apr 2026 | $978,700 | 100 | 186 | 317 | 3.2 | 28 | $998,944 | $1,420,691 | 99.0% |
| May 2026 | $985,500 | 127 | 238 | 365 | 2.9 | 26 | $1,150,000 | $1,401,987 | 99.0% |
| Jun 2026 | $996,800 | 132 | 234 | 366 | 2.8 | 28 | $987,400 | $1,330,483 | 99.0% |
| Jul 2026 | $992,000 | 103 | 181 | 370 | 3.6 | 34 | $900,000 | $1,147,739 | 99.0% |
| Aug 2026 | $995,700 | 97 | 182 | 378 | 3.9 | 39 | $1,005,000 | $1,244,434 | 98.0% |
| Sep 2026 | $981,300 | 106 | 200 | 372 | 3.5 | 37 | $1,025,000 | $1,377,229 | 98.0% |
September 2026 · semi-detached homes
In September 2026, the benchmark price for City Centre was $957,500, up 0.2% from September last year. 48 homes sold (unchanged), 107 new listings came on the market (up 8%), and there were 167 active listings at month end (up 9%). Among homes that sold, the median sale price was $943,750 (up 2.3%) and the average sale price was $996,452 (up 2.9%), and homes sold for 98.0% of their asking price. That is 3.5 months of supply, and homes spent 36 days on the market (up 6 days). Figures cover semi-detached homes.
View the numbers
| Measure | September 2026 | September last year |
|---|---|---|
| Benchmark price | $957,500 | $955,600 |
| Median price | $943,750 | $922,450 |
| Average price | $996,452 | $968,498 |
| Sold vs asking | 98.0% | 98.0% |
| Homes sold | 48 | 48 |
| New listings | 107 | 99 |
| Active listings | 167 | 153 |
| Months of supply | 3.5 | 3.2 |
| Days on market | 36 | 30 |
12-month trend
View the monthly numbers
| Month | Benchmark price | Sold | New listings | Active listings | Months of supply | Days on market | Median price | Average price | Sold vs asking |
|---|---|---|---|---|---|---|---|---|---|
| Oct 2025 | $946,000 | 44 | 82 | 159 | 3.6 | 38 | $887,500 | $938,643 | 98.0% |
| Nov 2025 | $926,000 | 46 | 47 | 128 | 2.8 | 38 | $880,000 | $894,759 | 98.0% |
| Dec 2025 | $924,500 | 29 | 24 | 77 | 2.7 | 54 | $894,600 | $919,874 | 98.0% |
| Jan 2026 | $919,300 | 24 | 73 | 105 | 4.4 | 58 | $943,500 | $965,021 | 98.0% |
| Feb 2026 | $951,400 | 41 | 72 | 111 | 2.7 | 46 | $1,028,000 | $1,008,829 | 99.0% |
| Mar 2026 | $949,600 | 64 | 88 | 117 | 1.8 | 36 | $957,384 | $978,648 | 99.0% |
| Apr 2026 | $957,000 | 57 | 83 | 128 | 2.3 | 31 | $975,000 | $967,582 | 99.0% |
| May 2026 | $955,000 | 49 | 92 | 144 | 2.9 | 31 | $930,000 | $942,914 | 99.0% |
| Jun 2026 | $971,800 | 71 | 96 | 140 | 2.0 | 33 | $1,025,000 | $998,948 | 98.0% |
| Jul 2026 | $968,100 | 44 | 74 | 135 | 3.1 | 30 | $980,000 | $983,619 | 99.0% |
| Aug 2026 | $965,700 | 41 | 90 | 146 | 3.6 | 32 | $924,000 | $983,388 | 98.0% |
| Sep 2026 | $957,500 | 48 | 107 | 167 | 3.5 | 36 | $943,750 | $996,452 | 98.0% |
September 2026 · row and townhouse homes
In September 2026, the benchmark price for City Centre was $566,200, down 4.8% from September last year. 36 homes sold (up 13%), 102 new listings came on the market (up 38%), and there were 165 active listings at month end (up 46%). Among homes that sold, the median sale price was $573,750 (down 12.1%) and the average sale price was $582,125 (down 11.4%), and homes sold for 98.0% of their asking price. That is 4.6 months of supply, and homes spent 46 days on the market (up 7 days). Figures cover row and townhouse homes.
View the numbers
| Measure | September 2026 | September last year |
|---|---|---|
| Benchmark price | $566,200 | $594,700 |
| Median price | $573,750 | $653,000 |
| Average price | $582,125 | $656,744 |
| Sold vs asking | 98.0% | 98.0% |
| Homes sold | 36 | 32 |
| New listings | 102 | 74 |
| Active listings | 165 | 113 |
| Months of supply | 4.6 | 3.5 |
| Days on market | 46 | 39 |
12-month trend
View the monthly numbers
| Month | Benchmark price | Sold | New listings | Active listings | Months of supply | Days on market | Median price | Average price | Sold vs asking |
|---|---|---|---|---|---|---|---|---|---|
| Oct 2025 | $598,900 | 33 | 67 | 120 | 3.6 | 32 | $610,000 | $571,498 | 98.0% |
| Nov 2025 | $583,500 | 31 | 50 | 113 | 3.7 | 33 | $560,000 | $556,274 | 97.0% |
| Dec 2025 | $567,000 | 25 | 23 | 70 | 2.8 | 60 | $536,000 | $562,352 | 97.0% |
| Jan 2026 | $583,800 | 16 | 68 | 105 | 6.6 | 36 | $611,500 | $620,828 | 100.0% |
| Feb 2026 | $594,400 | 35 | 68 | 121 | 3.5 | 33 | $605,000 | $637,055 | 98.0% |
| Mar 2026 | $584,700 | 53 | 83 | 130 | 2.5 | 39 | $557,500 | $542,219 | 98.0% |
| Apr 2026 | $572,300 | 57 | 85 | 135 | 2.4 | 41 | $627,500 | $587,939 | 99.0% |
| May 2026 | $573,200 | 53 | 96 | 150 | 2.8 | 32 | $590,000 | $594,075 | 98.0% |
| Jun 2026 | $585,100 | 37 | 80 | 149 | 4.0 | 32 | $525,000 | $538,093 | 98.0% |
| Jul 2026 | $577,100 | 36 | 65 | 144 | 4.0 | 40 | $558,500 | $549,747 | 98.0% |
| Aug 2026 | $574,100 | 32 | 72 | 152 | 4.8 | 43 | $590,000 | $615,844 | 98.0% |
| Sep 2026 | $566,200 | 36 | 102 | 165 | 4.6 | 46 | $573,750 | $582,125 | 98.0% |
September 2026 · apartment condos
In September 2026, the benchmark price for City Centre was $297,900, down 8.1% from September last year. 142 homes sold (down 19%), 331 new listings came on the market (down 17%), and there were 819 active listings at month end (down 6%). Among homes that sold, the median sale price was $293,000 (down 10.8%) and the average sale price was $325,487 (down 8.7%), and homes sold for 96.0% of their asking price. That is 5.8 months of supply, and homes spent 57 days on the market (up 6 days). Figures cover apartment condos.
View the numbers
| Measure | September 2026 | September last year |
|---|---|---|
| Benchmark price | $297,900 | $324,100 |
| Median price | $293,000 | $328,500 |
| Average price | $325,487 | $356,476 |
| Sold vs asking | 96.0% | 97.0% |
| Homes sold | 142 | 175 |
| New listings | 331 | 398 |
| Active listings | 819 | 869 |
| Months of supply | 5.8 | 5.0 |
| Days on market | 57 | 51 |
12-month trend
View the monthly numbers
| Month | Benchmark price | Sold | New listings | Active listings | Months of supply | Days on market | Median price | Average price | Sold vs asking |
|---|---|---|---|---|---|---|---|---|---|
| Oct 2025 | $320,600 | 168 | 345 | 820 | 4.9 | 51 | $322,000 | $374,054 | 97.0% |
| Nov 2025 | $313,800 | 135 | 234 | 741 | 5.5 | 67 | $310,000 | $403,388 | 97.0% |
| Dec 2025 | $308,400 | 115 | 136 | 513 | 4.5 | 56 | $312,000 | $372,928 | 96.0% |
| Jan 2026 | $309,600 | 115 | 320 | 584 | 5.1 | 69 | $311,000 | $356,910 | 96.0% |
| Feb 2026 | $305,600 | 144 | 312 | 634 | 4.4 | 57 | $323,000 | $371,638 | 96.0% |
| Mar 2026 | $308,800 | 167 | 398 | 738 | 4.4 | 41 | $324,000 | $378,091 | 97.0% |
| Apr 2026 | $309,900 | 181 | 401 | 809 | 4.5 | 45 | $330,000 | $366,052 | 97.0% |
| May 2026 | $306,000 | 167 | 428 | 906 | 5.4 | 43 | $300,000 | $330,721 | 97.0% |
| Jun 2026 | $305,700 | 177 | 399 | 913 | 5.2 | 43 | $307,500 | $339,046 | 97.0% |
| Jul 2026 | $304,400 | 161 | 329 | 872 | 5.4 | 55 | $316,500 | $390,307 | 96.0% |
| Aug 2026 | $303,500 | 109 | 297 | 835 | 7.7 | 54 | $295,000 | $345,760 | 96.0% |
| Sep 2026 | $297,900 | 142 | 331 | 819 | 5.8 | 57 | $293,000 | $325,487 | 96.0% |
Source: Calgary Real Estate Board (CREB®) monthly statistics. Benchmark price is the typical price of a home in the area. Median and average prices are for homes that sold in the month. Figures can be revised.
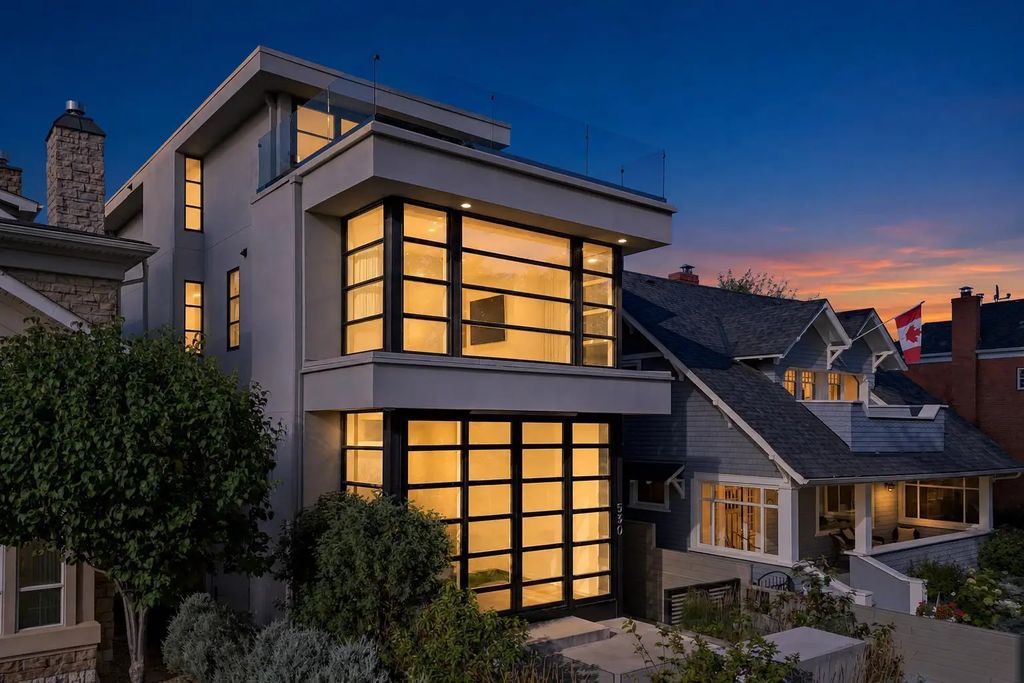
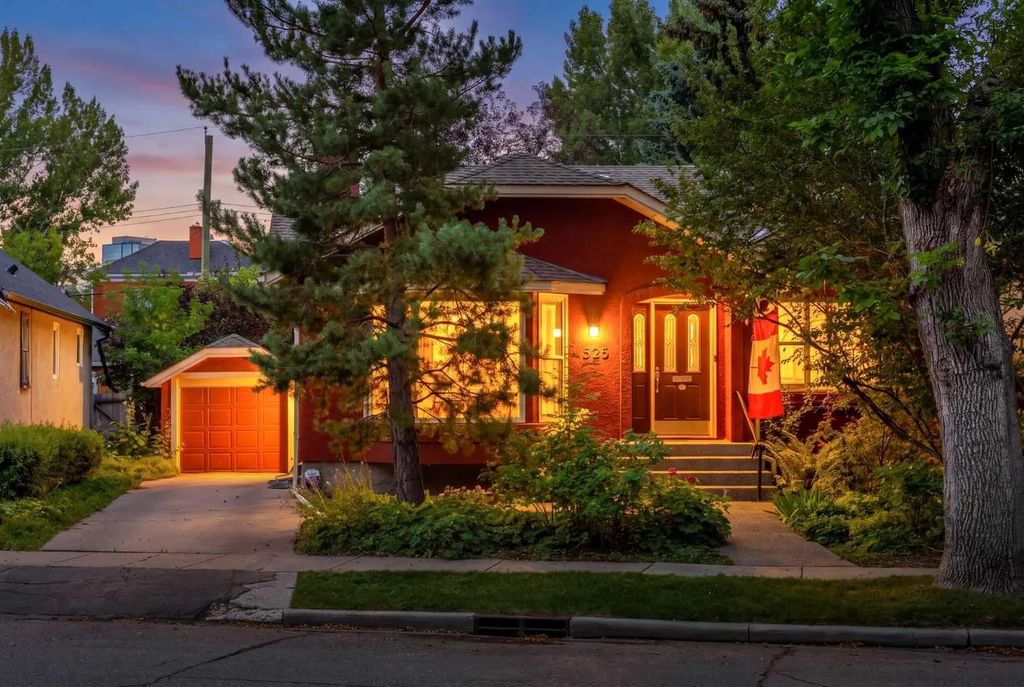
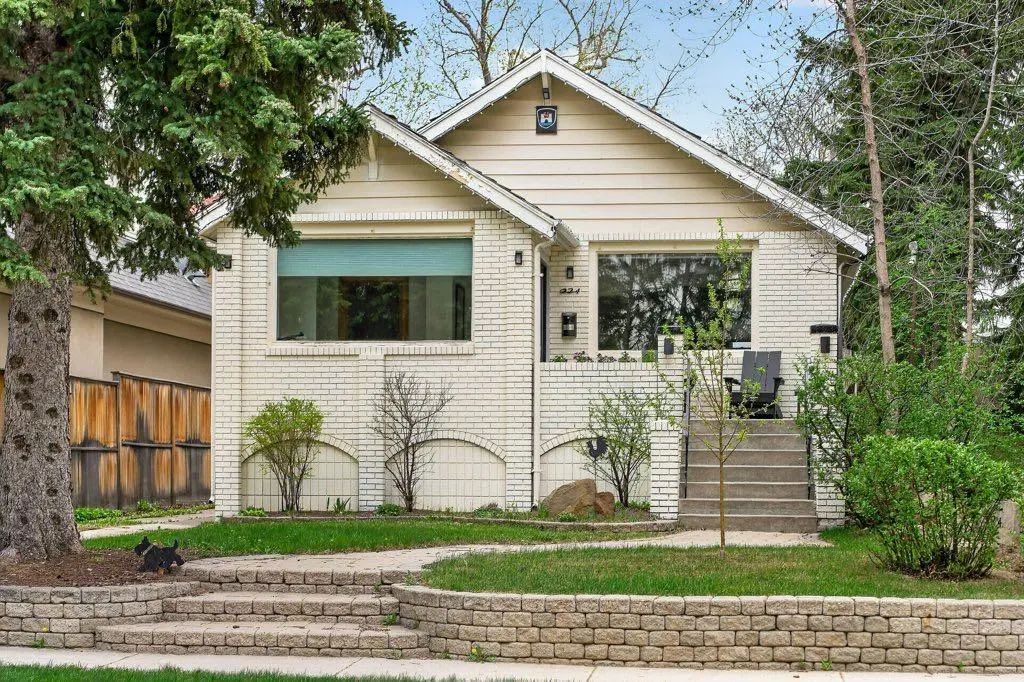
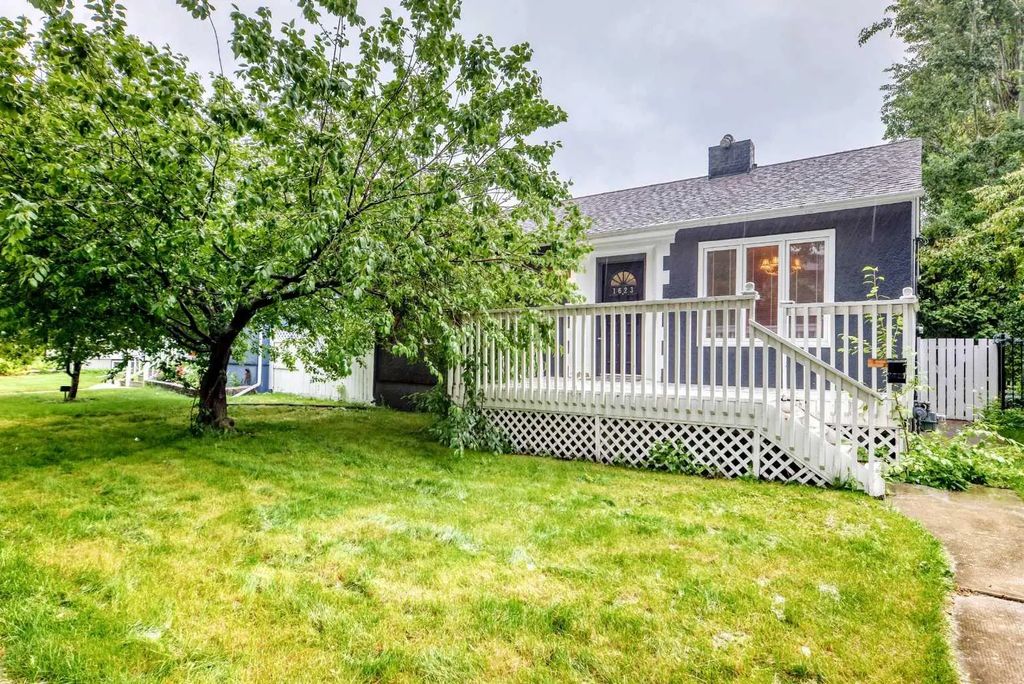
Rosedale is a hillside community in northwest Calgary, situated along the Bow River escarpment with land annexed to the city in 1907 and the neighbourhood established in 1929. Its elevated position gives many streets sweeping views over the Bow River valley and downtown Calgary, similar to neighbouring Crescent Heights. Rosedale is adjacent to SAIT Polytechnic and the North Hill Shopping Centre, giving residents easy access to education, shopping, and transit options. Housing consists mainly of character homes from the early-to-mid 1900s, with mature trees and established landscaping throughout the community. Its central location just north of downtown, combined with hillside views and walkable access to Kensington and 4th Street NW, makes Rosedale an appealing choice for buyers seeking an established inner-city community with character and views.
Rosedale MLS® Listings - Houses, Condos and Real Estate For Sale in NW Calgary
- All Listings
- $800,000 - $900,000
- Over $1,000,000



Frequently Asked Questions About Rosedale
When was Rosedale established?
The land was annexed to Calgary in 1907, and Rosedale was formally established as a community in 1929.
What views does Rosedale offer?
Rosedale sits on the Bow River escarpment, giving many streets sweeping views over the river valley and downtown Calgary.
Is Rosedale close to SAIT?
Yes, Rosedale is adjacent to SAIT Polytechnic and close to the North Hill Shopping Centre.
Featured Neighbourhoods in City Centre Calgary
- Altadore
- Bankview
- Banff Trail
- Bel-Aire
- Beltline
- Bridgeland/Riverside
- Britannia
- Cambrian Heights
- Capitol Hill
- Chinatown
- Cliff Bungalow
- Connaught
- Crescent Heights
- Downtown Core
- Downtown East Village
- Downtown West End
- Eau Claire
- Elbow Park
- Elboya
- Erlton
- Garrison Woods
- Greenview
- Highland Park
- Highwood
- Hillhurst
- Hounsfield Heights/Briar Hill
- Inglewood
- Killarney/Glengarry
- Lower Mount Royal
- Marda Loop
- Mayfair
- Meadowlark Park
- Mission
- Mount Pleasant
- Upper Mount Royal
- Parkdale
- Parkhill
- Point McKay
- Queens Park Village
- Ramsay
- Renfrew
- Richmond
- Rideau Park
- Rosedale
- Rosemont
- Roxboro
- Scarboro
- Shaganappi
- Signature Parke
- South Calgary
- St. Andrews Heights
- Sunalta
- Sunnyside
- Tuxedo Park
- Victoria Park
- West Hillhurst
- Windsor Park
- Winston Heights/Mountview