
Chinatown City Centre Calgary MLS® Listings
Houses, Condos and Real Estate For Sale by Calgary REALTORS®.
Chinatown Market Snapshot
September 2026 · all residential property types
In September 2026, the benchmark price for Chinatown was $295,000, down 6.9% from September last year. 3 homes sold (down 25%), 7 new listings came on the market (down 50%), and there were 26 active listings at month end (down 21%). Among homes that sold, the median sale price was $603,000 (up 9.0%) and the average sale price was $537,333 (down 20.0%), and homes sold for 97.0% of their asking price. That is 8.7 months of supply, and homes spent 30 days on the market (up 13 days). Figures cover all residential property types.
View the numbers
| Measure | September 2026 | September last year |
|---|---|---|
| Benchmark price | $295,000 | $316,700 |
| Median price | $603,000 | $553,000 |
| Average price | $537,333 | $671,500 |
| Sold vs asking | 97.0% | 95.0% |
| Homes sold | 3 | 4 |
| New listings | 7 | 14 |
| Active listings | 26 | 33 |
| Months of supply | 8.7 | 8.3 |
| Days on market | 30 | 17 |
12-month trend
View the monthly numbers
| Month | Benchmark price | Sold | New listings | Active listings | Months of supply | Days on market | Median price | Average price | Sold vs asking |
|---|---|---|---|---|---|---|---|---|---|
| Oct 2025 | $318,000 | 5 | 13 | 31 | 6.2 | 29 | $300,000 | $300,540 | 95.0% |
| Nov 2025 | $306,700 | 4 | 5 | 28 | 7.0 | 127 | $412,500 | $663,000 | 93.0% |
| Dec 2025 | $309,900 | 5 | 6 | 16 | 3.2 | 51 | $343,900 | $339,430 | 96.0% |
| Jan 2026 | $304,200 | 2 | 5 | 14 | 7.0 | 62 | $291,750 | $291,750 | 95.0% |
| Feb 2026 | $298,800 | 1 | 6 | 16 | 16.0 | 42 | $680,000 | $680,000 | 97.0% |
| Mar 2026 | $304,100 | 0 | 17 | 30 | n/a | n/a | n/a | n/a | n/a |
| Apr 2026 | $310,000 | 5 | 18 | 39 | 7.8 | 33 | $305,000 | $312,000 | 96.0% |
| May 2026 | $309,700 | 5 | 17 | 41 | 8.2 | 42 | $540,000 | $590,100 | 95.0% |
| Jun 2026 | $310,900 | 8 | 5 | 29 | 3.6 | 48 | $346,250 | $411,350 | 96.0% |
| Jul 2026 | $308,200 | 3 | 10 | 30 | 10.0 | 63 | $450,000 | $647,833 | 94.0% |
| Aug 2026 | $297,600 | 6 | 11 | 29 | 4.8 | 70 | $357,500 | $441,333 | 97.0% |
| Sep 2026 | $295,000 | 3 | 7 | 26 | 8.7 | 30 | $603,000 | $537,333 | 97.0% |
September 2026 · apartment condos
In September 2026, the benchmark price for Chinatown was $295,000, down 6.9% from September last year. 3 homes sold (down 25%), 7 new listings came on the market (down 50%), and there were 26 active listings at month end (down 21%). Among homes that sold, the median sale price was $603,000 (up 9.0%) and the average sale price was $537,333 (down 20.0%), and homes sold for 97.0% of their asking price. That is 8.7 months of supply, and homes spent 30 days on the market (up 13 days). Figures cover apartment condos.
View the numbers
| Measure | September 2026 | September last year |
|---|---|---|
| Benchmark price | $295,000 | $316,700 |
| Median price | $603,000 | $553,000 |
| Average price | $537,333 | $671,500 |
| Sold vs asking | 97.0% | 95.0% |
| Homes sold | 3 | 4 |
| New listings | 7 | 14 |
| Active listings | 26 | 33 |
| Months of supply | 8.7 | 8.3 |
| Days on market | 30 | 17 |
12-month trend
View the monthly numbers
| Month | Benchmark price | Sold | New listings | Active listings | Months of supply | Days on market | Median price | Average price | Sold vs asking |
|---|---|---|---|---|---|---|---|---|---|
| Oct 2025 | $318,000 | 5 | 13 | 31 | 6.2 | 29 | $300,000 | $300,540 | 95.0% |
| Nov 2025 | $306,700 | 4 | 5 | 28 | 7.0 | 127 | $412,500 | $663,000 | 93.0% |
| Dec 2025 | $309,900 | 5 | 6 | 16 | 3.2 | 51 | $343,900 | $339,430 | 96.0% |
| Jan 2026 | $304,200 | 2 | 5 | 14 | 7.0 | 62 | $291,750 | $291,750 | 95.0% |
| Feb 2026 | $298,800 | 1 | 6 | 16 | 16.0 | 42 | $680,000 | $680,000 | 97.0% |
| Mar 2026 | $304,100 | 0 | 17 | 30 | n/a | n/a | n/a | n/a | n/a |
| Apr 2026 | $310,000 | 5 | 18 | 39 | 7.8 | 33 | $305,000 | $312,000 | 96.0% |
| May 2026 | $309,700 | 5 | 16 | 40 | 8.0 | 42 | $540,000 | $590,100 | 95.0% |
| Jun 2026 | $310,900 | 8 | 5 | 28 | 3.5 | 48 | $346,250 | $411,350 | 96.0% |
| Jul 2026 | $308,200 | 3 | 10 | 29 | 9.7 | 63 | $450,000 | $647,833 | 94.0% |
| Aug 2026 | $297,600 | 5 | 11 | 29 | 5.8 | 70 | $310,000 | $417,600 | 98.0% |
| Sep 2026 | $295,000 | 3 | 7 | 26 | 8.7 | 30 | $603,000 | $537,333 | 97.0% |
Source: Calgary Real Estate Board (CREB®) monthly statistics. Benchmark price is the typical price of a home in the area. Median and average prices are for homes that sold in the month. Figures can be revised.
Sign Up for free
Get the first to receive the latest listing updates, save favorites & much more by signing up. Or already have in account,Sign in.
Chinatown MLS® Listings - Houses, Condos and Real Estate For Sale in SW Calgary
- All Listings
- Under $100,000
- $100,000 - $200,000
- $200,000 - $300,000
- $300,000 - $400,000
- $400,000 - $500,000
- $500,000 - $600,000
- $600,000 - $700,000
- $700,000 - $800,000
- $800,000 - $900,000
- Over $1,000,000





About Chinatown
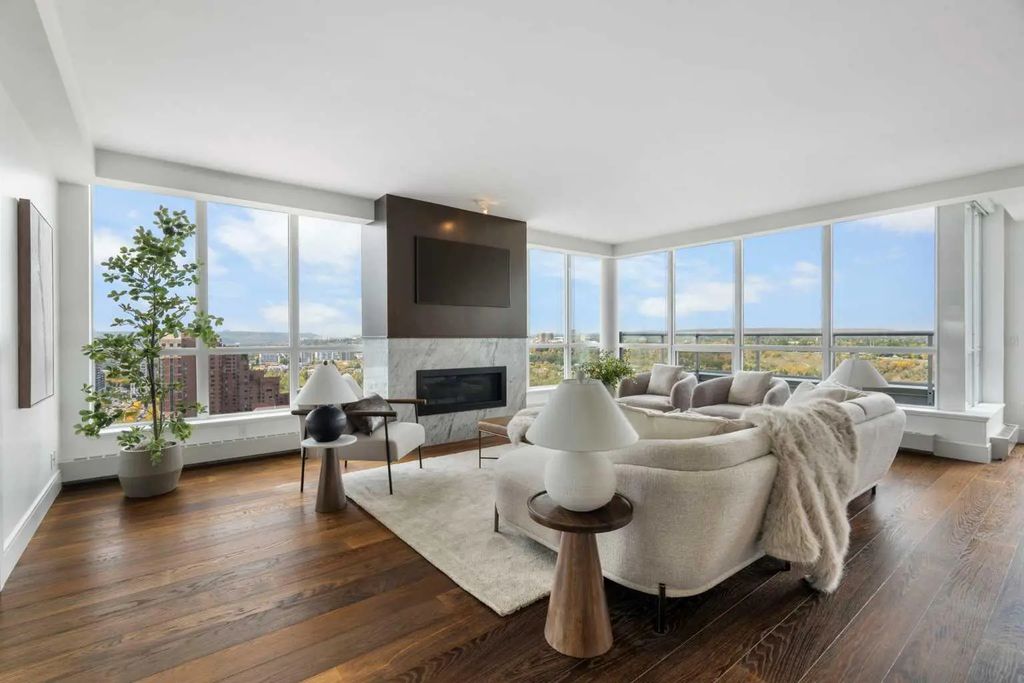
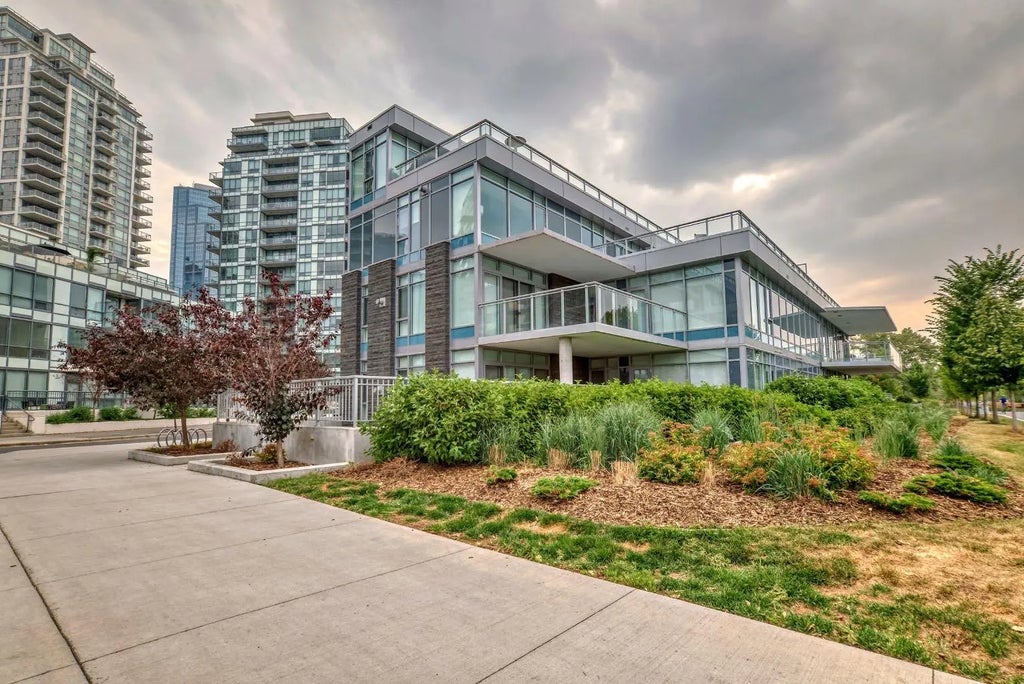
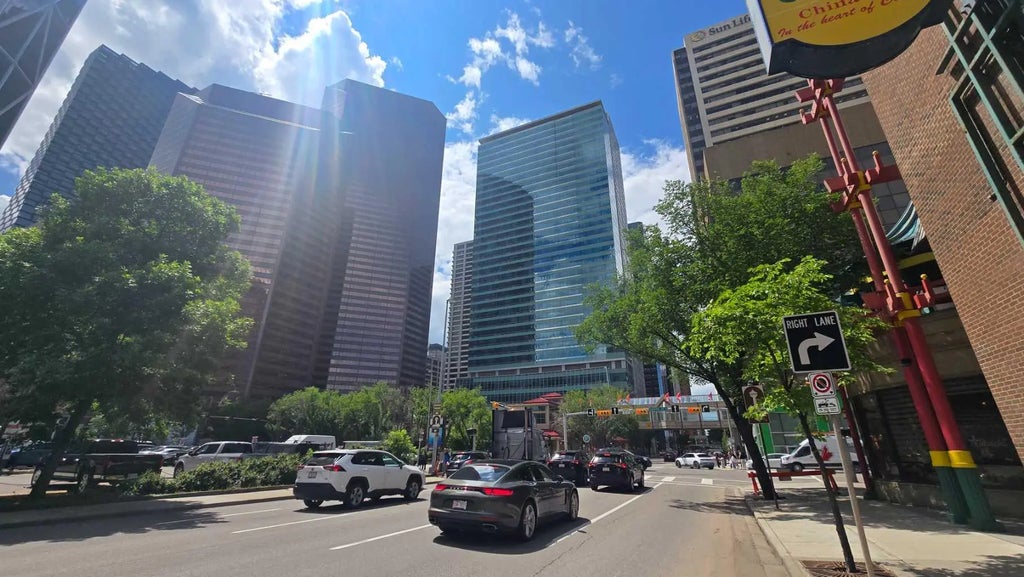
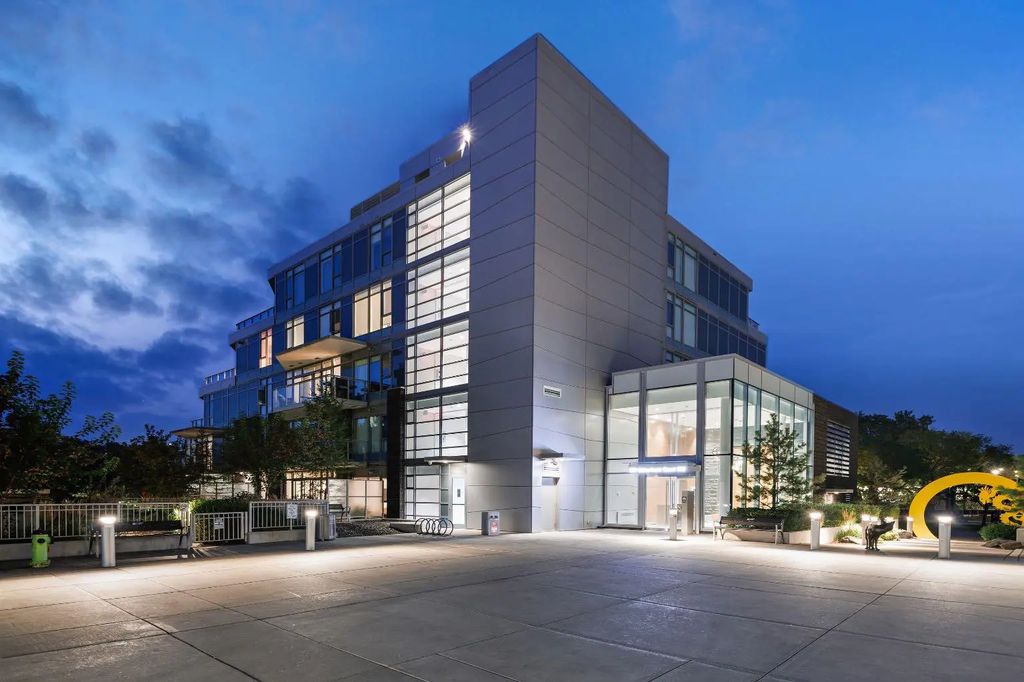
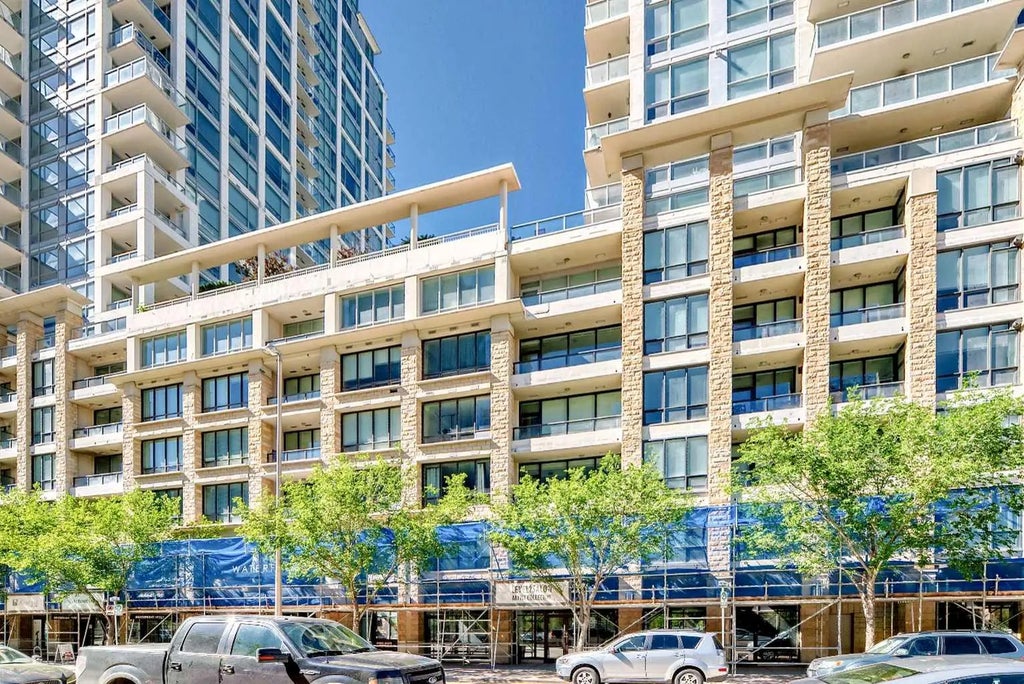
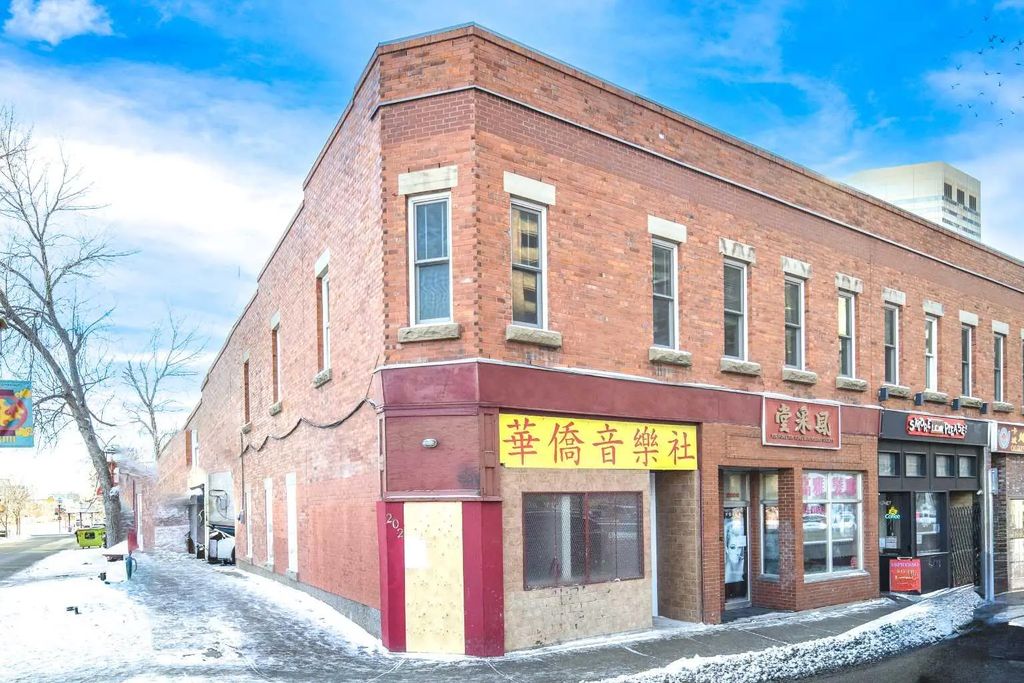
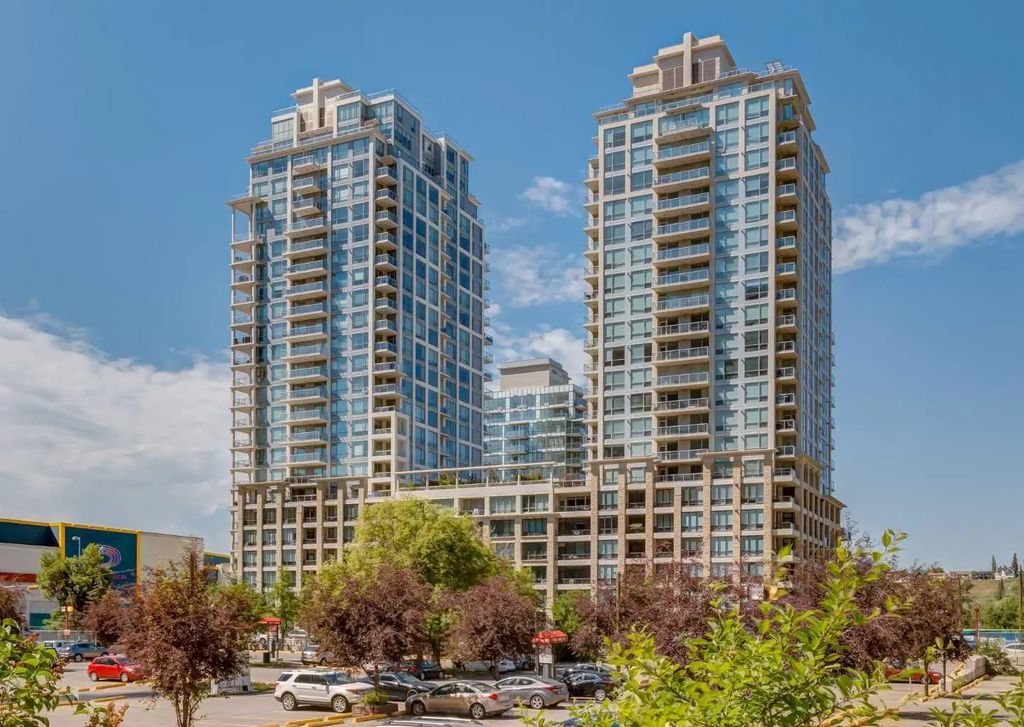
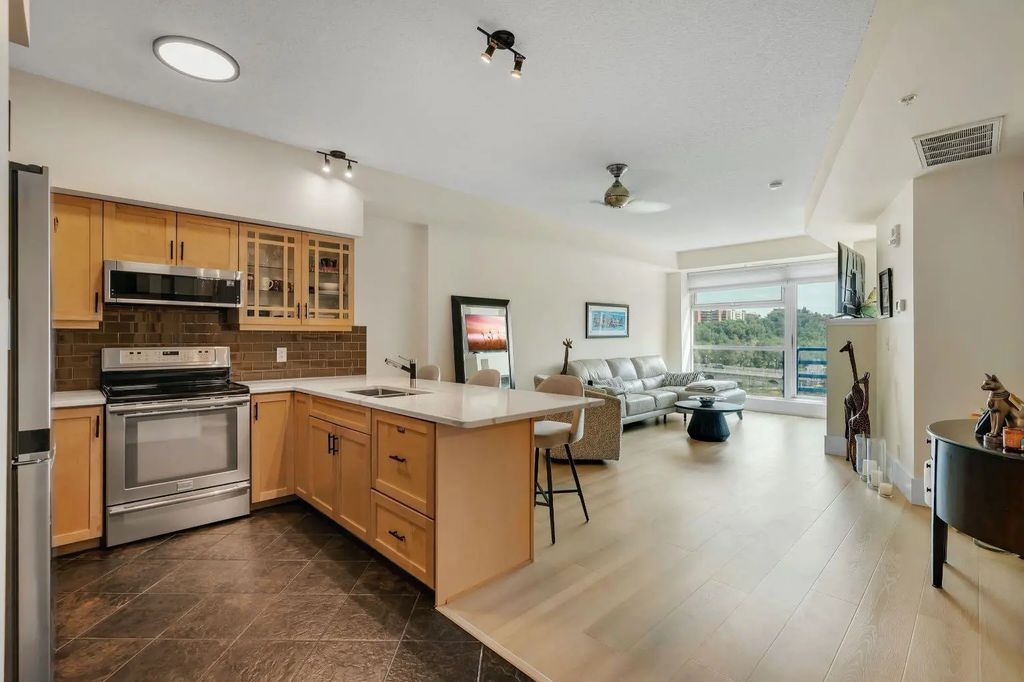
Chinatown is a small, historic inner-city community along the Bow River, just west of downtown Calgary. Known for its cultural shops, restaurants and the Calgary Chinese Cultural Centre, it offers a walkable, riverside lifestyle with quick access to Eau Claire, Prince’s Island Park and the downtown core. Housing here is mostly low-rise and mid-rise condos, appealing to buyers who want an urban, amenity-rich location without the scale of a downtown high-rise.
Frequently Asked Questions
What kind of homes are in Chinatown?
Chinatown is made up mostly of low-rise and mid-rise condo buildings.
What’s nearby Chinatown?
The Calgary Chinese Cultural Centre, Eau Claire and Prince’s Island Park are all within walking distance, along with quick access to the downtown core.
Is Chinatown a walkable neighbourhood?
Yes — Chinatown’s riverside, inner-city location makes it an easy walk to downtown, Eau Claire and the Bow River pathway system.
#featured-sw#