
Westwinds NE Calgary MLS® Listings
Houses, Condos and Real Estate For Sale by Calgary REALTORS®.
Northeast Calgary Market Snapshot
Westwinds is part of Northeast Calgary. CREB reports statistics for Northeast Calgary, so this snapshot shows Northeast Calgary.
September 2026 · all residential property types
In September 2026, the benchmark price for Northeast Calgary was $461,200, down 6.1% from September last year. 129 homes sold (down 32%), 370 new listings came on the market (down 25%), and there were 834 active listings at month end (down 18%). Among homes that sold, the median sale price was $482,500 (down 9.0%) and the average sale price was $496,243 (down 3.6%), and homes sold for 96.0% of their asking price. That is 6.5 months of supply, and homes spent 49 days on the market (up 7 days). Figures cover all residential property types.
View the numbers
| Measure | September 2026 | September last year |
|---|---|---|
| Benchmark price | $461,200 | $491,200 |
| Median price | $482,500 | $530,000 |
| Average price | $496,243 | $514,569 |
| Sold vs asking | 96.0% | 97.0% |
| Homes sold | 129 | 191 |
| New listings | 370 | 496 |
| Active listings | 834 | 1,012 |
| Months of supply | 6.5 | 5.3 |
| Days on market | 49 | 42 |
12-month trend
View the monthly numbers
| Month | Benchmark price | Sold | New listings | Active listings | Months of supply | Days on market | Median price | Average price | Sold vs asking |
|---|---|---|---|---|---|---|---|---|---|
| Oct 2025 | $485,000 | 167 | 417 | 952 | 5.7 | 45 | $495,000 | $489,601 | 97.0% |
| Nov 2025 | $482,100 | 164 | 315 | 815 | 5.0 | 50 | $507,500 | $496,291 | 97.0% |
| Dec 2025 | $473,200 | 117 | 210 | 627 | 5.4 | 50 | $485,000 | $480,130 | 96.0% |
| Jan 2026 | $472,100 | 149 | 344 | 610 | 4.1 | 61 | $515,000 | $512,391 | 97.0% |
| Feb 2026 | $471,200 | 116 | 354 | 702 | 6.1 | 44 | $488,750 | $494,531 | 97.0% |
| Mar 2026 | $473,800 | 159 | 399 | 770 | 4.8 | 42 | $483,000 | $481,245 | 97.0% |
| Apr 2026 | $468,600 | 173 | 437 | 810 | 4.7 | 44 | $495,000 | $492,241 | 97.0% |
| May 2026 | $467,800 | 205 | 502 | 913 | 4.5 | 44 | $481,111 | $480,165 | 97.0% |
| Jun 2026 | $465,600 | 200 | 444 | 907 | 4.5 | 44 | $486,250 | $484,064 | 97.0% |
| Jul 2026 | $466,400 | 171 | 402 | 911 | 5.3 | 43 | $470,000 | $455,708 | 97.0% |
| Aug 2026 | $464,200 | 158 | 390 | 851 | 5.4 | 45 | $485,000 | $473,091 | 97.0% |
| Sep 2026 | $461,200 | 129 | 370 | 834 | 6.5 | 49 | $482,500 | $496,243 | 96.0% |
September 2026 · detached homes
In September 2026, the benchmark price for Northeast Calgary was $556,600, down 6.0% from September last year. 88 homes sold (down 27%), 235 new listings came on the market (down 16%), and there were 496 active listings at month end (down 8%). Among homes that sold, the median sale price was $547,450 (down 9.1%) and the average sale price was $566,228 (down 5.6%), and homes sold for 97.0% of their asking price. That is 5.6 months of supply, and homes spent 44 days on the market (up 6 days). Figures cover detached homes.
View the numbers
| Measure | September 2026 | September last year |
|---|---|---|
| Benchmark price | $556,600 | $592,200 |
| Median price | $547,450 | $602,500 |
| Average price | $566,228 | $599,809 |
| Sold vs asking | 97.0% | 98.0% |
| Homes sold | 88 | 120 |
| New listings | 235 | 279 |
| Active listings | 496 | 537 |
| Months of supply | 5.6 | 4.5 |
| Days on market | 44 | 38 |
12-month trend
View the monthly numbers
| Month | Benchmark price | Sold | New listings | Active listings | Months of supply | Days on market | Median price | Average price | Sold vs asking |
|---|---|---|---|---|---|---|---|---|---|
| Oct 2025 | $586,600 | 103 | 245 | 514 | 5.0 | 38 | $565,000 | $571,367 | 97.0% |
| Nov 2025 | $584,000 | 102 | 171 | 427 | 4.2 | 47 | $554,750 | $580,685 | 97.0% |
| Dec 2025 | $573,700 | 73 | 114 | 330 | 4.5 | 49 | $535,100 | $561,667 | 97.0% |
| Jan 2026 | $573,400 | 96 | 176 | 314 | 3.3 | 60 | $575,000 | $582,620 | 97.0% |
| Feb 2026 | $572,900 | 64 | 183 | 348 | 5.4 | 38 | $574,250 | $585,219 | 97.0% |
| Mar 2026 | $574,800 | 93 | 220 | 386 | 4.2 | 41 | $558,000 | $564,190 | 97.0% |
| Apr 2026 | $565,100 | 101 | 237 | 411 | 4.1 | 45 | $566,000 | $587,625 | 98.0% |
| May 2026 | $563,900 | 122 | 326 | 509 | 4.2 | 38 | $552,500 | $562,234 | 97.0% |
| Jun 2026 | $560,700 | 123 | 260 | 510 | 4.2 | 41 | $575,000 | $572,418 | 97.0% |
| Jul 2026 | $563,900 | 96 | 243 | 520 | 5.4 | 41 | $531,250 | $543,967 | 97.0% |
| Aug 2026 | $560,500 | 93 | 252 | 498 | 5.4 | 39 | $549,000 | $561,133 | 98.0% |
| Sep 2026 | $556,600 | 88 | 235 | 496 | 5.6 | 44 | $547,450 | $566,228 | 97.0% |
September 2026 · semi-detached homes
In September 2026, the benchmark price for Northeast Calgary was $416,500, down 6.0% from September last year. 9 homes sold (down 61%), 33 new listings came on the market (down 37%), and there were 71 active listings at month end (down 26%). Among homes that sold, the median sale price was $423,000 (down 9.0%) and the average sale price was $426,944 (down 5.0%), and homes sold for 95.0% of their asking price. That is 7.9 months of supply, and homes spent 59 days on the market (up 22 days). Figures cover semi-detached homes.
View the numbers
| Measure | September 2026 | September last year |
|---|---|---|
| Benchmark price | $416,500 | $443,200 |
| Median price | $423,000 | $465,000 |
| Average price | $426,944 | $449,400 |
| Sold vs asking | 95.0% | 98.0% |
| Homes sold | 9 | 23 |
| New listings | 33 | 52 |
| Active listings | 71 | 96 |
| Months of supply | 7.9 | 4.2 |
| Days on market | 59 | 37 |
12-month trend
View the monthly numbers
| Month | Benchmark price | Sold | New listings | Active listings | Months of supply | Days on market | Median price | Average price | Sold vs asking |
|---|---|---|---|---|---|---|---|---|---|
| Oct 2025 | $438,600 | 20 | 46 | 87 | 4.4 | 43 | $470,000 | $482,700 | 97.0% |
| Nov 2025 | $440,500 | 15 | 34 | 86 | 5.7 | 33 | $445,000 | $462,667 | 98.0% |
| Dec 2025 | $429,200 | 10 | 22 | 65 | 6.5 | 54 | $496,500 | $475,100 | 97.0% |
| Jan 2026 | $434,100 | 19 | 32 | 52 | 2.7 | 54 | $482,500 | $489,600 | 97.0% |
| Feb 2026 | $435,500 | 20 | 42 | 61 | 3.1 | 50 | $421,750 | $438,075 | 96.0% |
| Mar 2026 | $435,900 | 21 | 37 | 64 | 3.1 | 36 | $418,000 | $437,429 | 98.0% |
| Apr 2026 | $425,500 | 20 | 57 | 78 | 3.9 | 38 | $427,250 | $450,875 | 97.0% |
| May 2026 | $422,900 | 23 | 46 | 83 | 3.6 | 35 | $452,500 | $452,011 | 97.0% |
| Jun 2026 | $422,900 | 18 | 41 | 81 | 4.5 | 31 | $462,000 | $457,167 | 97.0% |
| Jul 2026 | $427,600 | 23 | 43 | 81 | 3.5 | 45 | $442,000 | $442,587 | 97.0% |
| Aug 2026 | $423,300 | 16 | 32 | 74 | 4.6 | 45 | $411,750 | $440,419 | 97.0% |
| Sep 2026 | $416,500 | 9 | 33 | 71 | 7.9 | 59 | $423,000 | $426,944 | 95.0% |
September 2026 · row and townhouse homes
In September 2026, the benchmark price for Northeast Calgary was $326,100, down 11.9% from September last year. 24 homes sold (down 17%), 59 new listings came on the market (down 37%), and there were 144 active listings at month end (down 32%). Among homes that sold, the median sale price was $357,500 (down 3.1%) and the average sale price was $353,199 (down 6.7%), and homes sold for 96.0% of their asking price. That is 6.0 months of supply, and homes spent 62 days on the market (up 10 days). Figures cover row and townhouse homes.
View the numbers
| Measure | September 2026 | September last year |
|---|---|---|
| Benchmark price | $326,100 | $370,000 |
| Median price | $357,500 | $369,000 |
| Average price | $353,199 | $378,414 |
| Sold vs asking | 96.0% | 97.0% |
| Homes sold | 24 | 29 |
| New listings | 59 | 94 |
| Active listings | 144 | 211 |
| Months of supply | 6.0 | 7.3 |
| Days on market | 62 | 52 |
12-month trend
View the monthly numbers
| Month | Benchmark price | Sold | New listings | Active listings | Months of supply | Days on market | Median price | Average price | Sold vs asking |
|---|---|---|---|---|---|---|---|---|---|
| Oct 2025 | $360,600 | 21 | 65 | 188 | 9.0 | 52 | $340,000 | $354,988 | 96.0% |
| Nov 2025 | $356,200 | 24 | 69 | 160 | 6.7 | 50 | $372,150 | $375,536 | 97.0% |
| Dec 2025 | $348,400 | 19 | 48 | 131 | 6.9 | 42 | $367,500 | $365,132 | 95.0% |
| Jan 2026 | $344,000 | 25 | 68 | 127 | 5.1 | 58 | $347,000 | $356,773 | 97.0% |
| Feb 2026 | $342,700 | 20 | 79 | 161 | 8.1 | 48 | $417,393 | $408,303 | 97.0% |
| Mar 2026 | $344,600 | 29 | 89 | 183 | 6.3 | 41 | $375,000 | $381,662 | 97.0% |
| Apr 2026 | $349,000 | 33 | 82 | 182 | 5.5 | 43 | $335,000 | $366,295 | 97.0% |
| May 2026 | $347,400 | 43 | 81 | 186 | 4.3 | 62 | $332,000 | $356,946 | 97.0% |
| Jun 2026 | $345,500 | 38 | 85 | 184 | 4.8 | 52 | $330,250 | $342,892 | 96.0% |
| Jul 2026 | $334,400 | 32 | 70 | 179 | 5.6 | 40 | $327,000 | $334,379 | 96.0% |
| Aug 2026 | $331,100 | 36 | 60 | 153 | 4.3 | 59 | $328,250 | $340,400 | 96.0% |
| Sep 2026 | $326,100 | 24 | 59 | 144 | 6.0 | 62 | $357,500 | $353,199 | 96.0% |
September 2026 · apartment condos
In September 2026, the benchmark price for Northeast Calgary was $249,500, down 13.1% from September last year. 8 homes sold (down 58%), 43 new listings came on the market (down 39%), and there were 123 active listings at month end (down 27%). Among homes that sold, the median sale price was $234,250 (down 11.3%) and the average sale price was $233,500 (down 11.2%), and homes sold for 95.0% of their asking price. That is 15.4 months of supply, and homes spent 59 days on the market (down 2 days). Figures cover apartment condos.
View the numbers
| Measure | September 2026 | September last year |
|---|---|---|
| Benchmark price | $249,500 | $287,000 |
| Median price | $234,250 | $264,000 |
| Average price | $233,500 | $262,912 |
| Sold vs asking | 95.0% | 96.0% |
| Homes sold | 8 | 19 |
| New listings | 43 | 71 |
| Active listings | 123 | 168 |
| Months of supply | 15.4 | 8.8 |
| Days on market | 59 | 61 |
12-month trend
View the monthly numbers
| Month | Benchmark price | Sold | New listings | Active listings | Months of supply | Days on market | Median price | Average price | Sold vs asking |
|---|---|---|---|---|---|---|---|---|---|
| Oct 2025 | $279,300 | 23 | 61 | 163 | 7.1 | 71 | $255,000 | $252,337 | 95.0% |
| Nov 2025 | $273,400 | 23 | 41 | 142 | 6.2 | 72 | $270,000 | $269,952 | 96.0% |
| Dec 2025 | $269,900 | 15 | 26 | 101 | 6.7 | 67 | $233,000 | $232,333 | 95.0% |
| Jan 2026 | $266,800 | 9 | 68 | 117 | 13.0 | 90 | $250,000 | $243,667 | 94.0% |
| Feb 2026 | $260,600 | 12 | 50 | 132 | 11.0 | 61 | $248,750 | $248,667 | 95.0% |
| Mar 2026 | $264,400 | 16 | 53 | 137 | 8.6 | 58 | $235,750 | $237,131 | 95.0% |
| Apr 2026 | $261,500 | 19 | 61 | 139 | 7.3 | 45 | $253,000 | $247,489 | 95.0% |
| May 2026 | $260,000 | 17 | 49 | 135 | 7.9 | 58 | $240,000 | $240,965 | 96.0% |
| Jun 2026 | $254,600 | 21 | 58 | 132 | 6.3 | 58 | $235,000 | $245,067 | 95.0% |
| Jul 2026 | $253,400 | 20 | 46 | 131 | 6.6 | 49 | $246,500 | $241,275 | 94.0% |
| Aug 2026 | $251,900 | 13 | 46 | 126 | 9.7 | 52 | $235,700 | $250,919 | 94.0% |
| Sep 2026 | $249,500 | 8 | 43 | 123 | 15.4 | 59 | $234,250 | $233,500 | 95.0% |
Source: Calgary Real Estate Board (CREB®) monthly statistics. Benchmark price is the typical price of a home in the area. Median and average prices are for homes that sold in the month. Figures can be revised.
Sign Up for free
Get the first to receive the latest listing updates, save favorites & much more by signing up. Or already have in account,Sign in.
Westwinds MLS® Listings - Houses, Condos and Real Estate For Sale in NE Calgary
- All Listings
- Under $100,000
- $100,000 - $200,000
- $400,000 - $500,000
- $500,000 - $600,000
- $600,000 - $700,000
- $700,000 - $800,000
- $800,000 - $900,000
- Over $1,000,000





About Westwinds
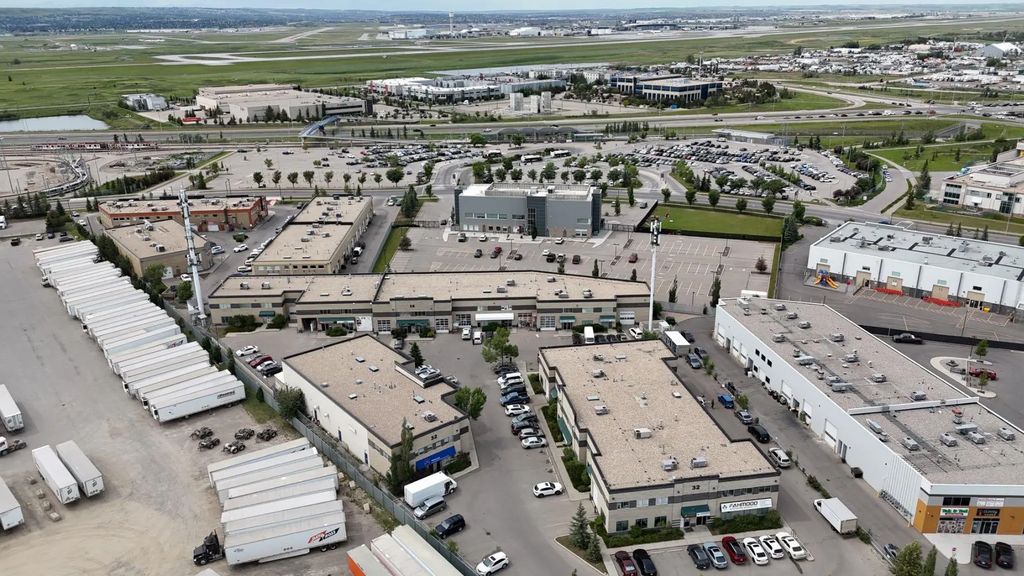
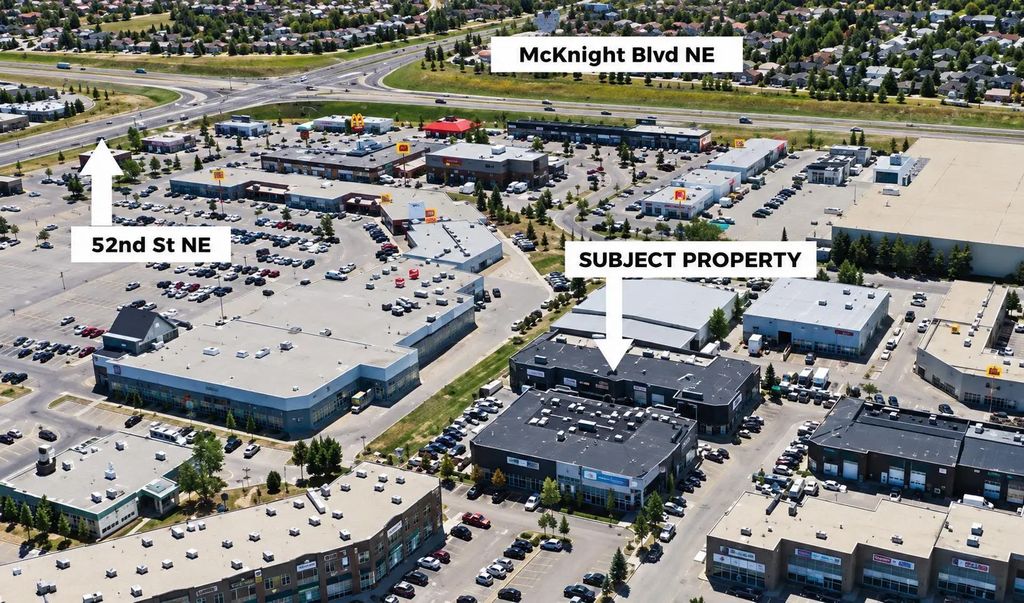
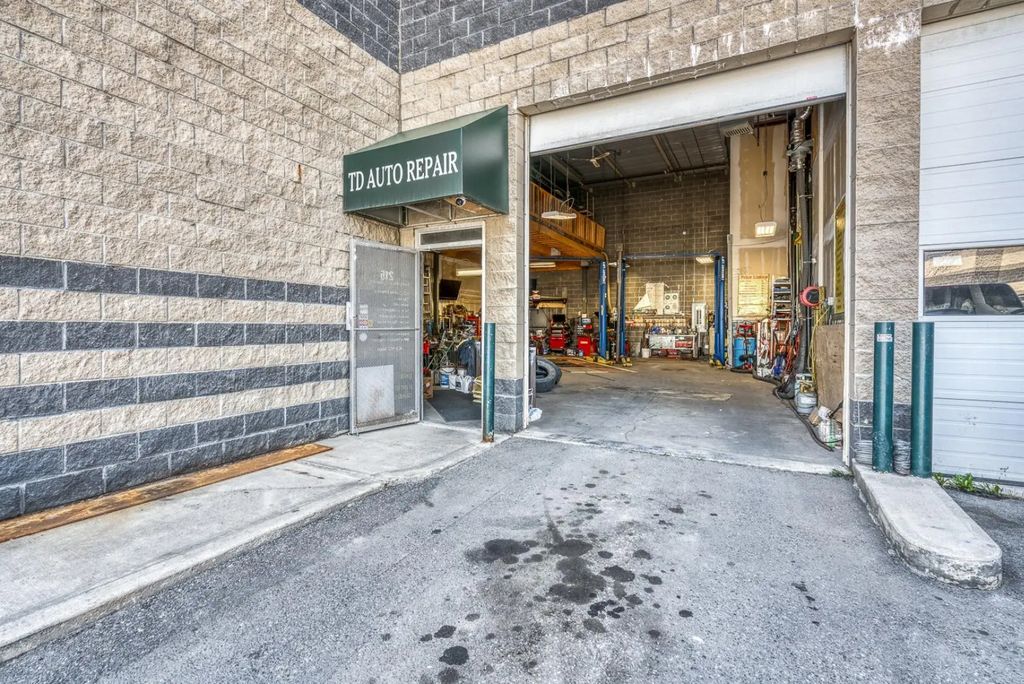
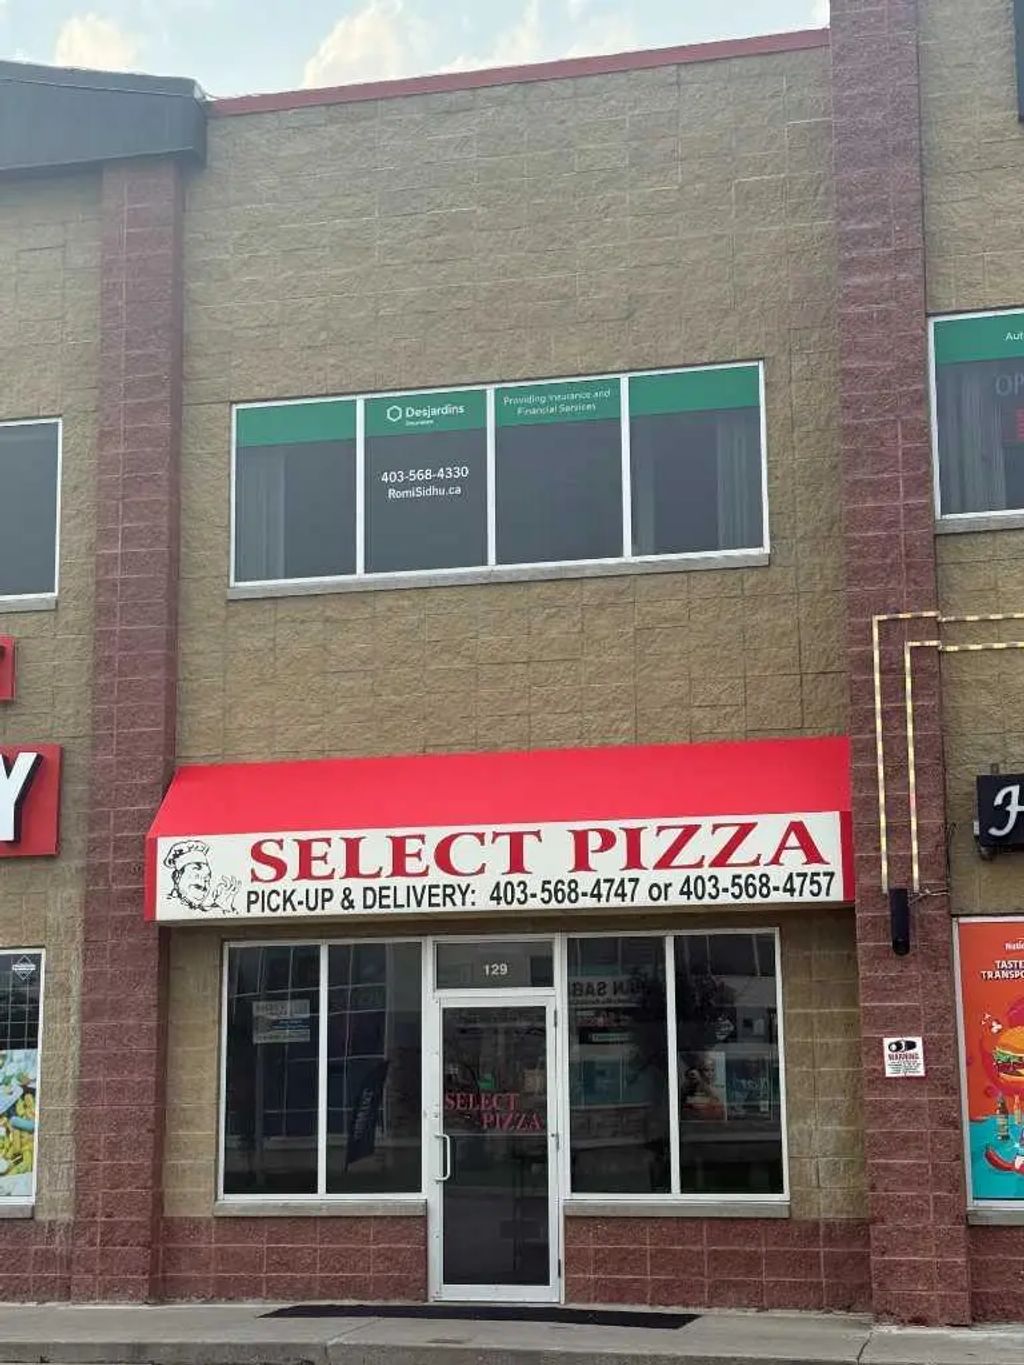
Westwinds is a transit-oriented community in northeast Calgary, centred around the Westwinds LRT Station on the Blue Line, with a mix of condo and apartment-style residences alongside nearby office and retail space. Its location near McKnight Boulevard and Barlow Trail makes it a convenient option for commuters who want easy access to downtown without a car, along with nearby shopping and dining along 36 Street NE.
Frequently Asked Questions
What kind of homes are in Westwinds?
Westwinds is made up mostly of condo and apartment-style homes.
Is Westwinds close to transit?
Yes — the Westwinds LRT Station sits right in the community, offering a direct Blue Line connection to downtown Calgary.
What’s nearby Westwinds?
Retail and dining along 36 Street NE and McKnight Boulevard are just minutes away, along with quick access to Barlow Trail and Stoney Trail.