
Skyview Ranch NE Calgary MLS® Listings
Houses, Condos and Real Estate For Sale.
Skyview Ranch Market Snapshot
September 2026 · all residential property types
In September 2026, the benchmark price for Skyview Ranch was $332,800, down 10.8% from September last year. 12 homes sold (down 45%), 45 new listings came on the market (down 27%), and there were 86 active listings at month end (down 33%). Among homes that sold, the median sale price was $260,000 (down 20.6%) and the average sale price was $370,125 (down 12.7%), and homes sold for 96.0% of their asking price. That is 7.2 months of supply, and homes spent 56 days on the market (up 1 days). Figures cover all residential property types.
View the numbers
| Measure | September 2026 | September last year |
|---|---|---|
| Benchmark price | $332,800 | $373,000 |
| Median price | $260,000 | $327,500 |
| Average price | $370,125 | $424,182 |
| Sold vs asking | 96.0% | 97.0% |
| Homes sold | 12 | 22 |
| New listings | 45 | 62 |
| Active listings | 86 | 129 |
| Months of supply | 7.2 | 5.9 |
| Days on market | 56 | 55 |
12-month trend
View the monthly numbers
| Month | Benchmark price | Sold | New listings | Active listings | Months of supply | Days on market | Median price | Average price | Sold vs asking |
|---|---|---|---|---|---|---|---|---|---|
| Oct 2025 | $361,400 | 24 | 37 | 104 | 4.3 | 60 | $273,875 | $314,508 | 96.0% |
| Nov 2025 | $355,300 | 18 | 29 | 82 | 4.6 | 55 | $375,000 | $399,750 | 98.0% |
| Dec 2025 | $350,900 | 11 | 23 | 69 | 6.3 | 58 | $290,000 | $327,182 | 97.0% |
| Jan 2026 | $349,100 | 17 | 40 | 62 | 3.7 | 84 | $461,000 | $459,759 | 95.0% |
| Feb 2026 | $342,300 | 9 | 41 | 82 | 9.1 | 44 | $318,000 | $410,667 | 97.0% |
| Mar 2026 | $346,100 | 15 | 45 | 94 | 6.3 | 41 | $277,000 | $322,760 | 96.0% |
| Apr 2026 | $344,400 | 20 | 47 | 96 | 4.8 | 45 | $327,750 | $405,207 | 97.0% |
| May 2026 | $341,700 | 17 | 41 | 101 | 5.9 | 40 | $265,000 | $356,376 | 96.0% |
| Jun 2026 | $337,900 | 19 | 37 | 87 | 4.6 | 56 | $520,000 | $464,935 | 97.0% |
| Jul 2026 | $335,100 | 15 | 35 | 85 | 5.7 | 44 | $306,500 | $314,966 | 96.0% |
| Aug 2026 | $334,600 | 19 | 45 | 85 | 4.5 | 36 | $349,250 | $389,024 | 95.0% |
| Sep 2026 | $332,800 | 12 | 45 | 86 | 7.2 | 56 | $260,000 | $370,125 | 96.0% |
September 2026 · detached homes
In September 2026, the benchmark price for Skyview Ranch was $624,300, down 6.9% from September last year. 3 homes sold (down 63%), 17 new listings came on the market (up 70%), and there were 22 active listings at month end (up 22%). Among homes that sold, the median sale price was $668,500 (up 7.1%) and the average sale price was $639,500 (up 0.1%), and homes sold for 97.0% of their asking price. That is 7.3 months of supply, and homes spent 74 days on the market (up 27 days). Figures cover detached homes.
View the numbers
| Measure | September 2026 | September last year |
|---|---|---|
| Benchmark price | $624,300 | $670,700 |
| Median price | $668,500 | $624,000 |
| Average price | $639,500 | $638,625 |
| Sold vs asking | 97.0% | 98.0% |
| Homes sold | 3 | 8 |
| New listings | 17 | 10 |
| Active listings | 22 | 18 |
| Months of supply | 7.3 | 2.3 |
| Days on market | 74 | 47 |
12-month trend
View the monthly numbers
| Month | Benchmark price | Sold | New listings | Active listings | Months of supply | Days on market | Median price | Average price | Sold vs asking |
|---|---|---|---|---|---|---|---|---|---|
| Oct 2025 | $669,700 | 3 | 10 | 15 | 5.0 | 23 | $599,950 | $604,983 | 99.0% |
| Nov 2025 | $661,900 | 4 | 7 | 12 | 3.0 | 34 | $593,000 | $616,500 | 98.0% |
| Dec 2025 | $657,600 | 2 | 4 | 11 | 5.5 | 15 | $518,500 | $518,500 | 99.0% |
| Jan 2026 | $647,200 | 7 | 5 | 8 | 1.1 | 62 | $630,000 | $631,771 | 97.0% |
| Feb 2026 | $642,000 | 3 | 6 | 10 | 3.3 | 25 | $705,000 | $662,667 | 97.0% |
| Mar 2026 | $639,600 | 1 | 6 | 13 | 13.0 | 17 | $592,000 | $592,000 | 97.0% |
| Apr 2026 | $635,700 | 5 | 10 | 16 | 3.2 | 30 | $713,000 | $666,968 | 99.0% |
| May 2026 | $631,800 | 4 | 15 | 25 | 6.3 | 43 | $635,000 | $632,250 | 99.0% |
| Jun 2026 | $633,600 | 9 | 11 | 20 | 2.2 | 44 | $595,500 | $638,152 | 96.0% |
| Jul 2026 | $629,800 | 0 | 6 | 20 | n/a | n/a | n/a | n/a | n/a |
| Aug 2026 | $626,400 | 6 | 11 | 21 | 3.5 | 28 | $602,500 | $600,167 | 96.0% |
| Sep 2026 | $624,300 | 3 | 17 | 22 | 7.3 | 74 | $668,500 | $639,500 | 97.0% |
September 2026 · apartment condos
In September 2026, the benchmark price for Skyview Ranch was $260,000, down 13.9% from September last year. 7 homes sold (down 36%), 19 new listings came on the market (down 47%), and there were 50 active listings at month end (down 38%). Among homes that sold, the median sale price was $235,000 (down 14.2%) and the average sale price was $239,571 (down 10.9%), and homes sold for 94.0% of their asking price. That is 7.1 months of supply, and homes spent 56 days on the market (down 9 days). Figures cover apartment condos.
View the numbers
| Measure | September 2026 | September last year |
|---|---|---|
| Benchmark price | $260,000 | $301,900 |
| Median price | $235,000 | $274,000 |
| Average price | $239,571 | $268,909 |
| Sold vs asking | 94.0% | 96.0% |
| Homes sold | 7 | 11 |
| New listings | 19 | 36 |
| Active listings | 50 | 81 |
| Months of supply | 7.1 | 7.4 |
| Days on market | 56 | 65 |
12-month trend
View the monthly numbers
| Month | Benchmark price | Sold | New listings | Active listings | Months of supply | Days on market | Median price | Average price | Sold vs asking |
|---|---|---|---|---|---|---|---|---|---|
| Oct 2025 | $292,700 | 18 | 16 | 61 | 3.4 | 65 | $254,500 | $249,347 | 95.0% |
| Nov 2025 | $286,100 | 8 | 17 | 47 | 5.9 | 80 | $270,000 | $275,688 | 95.0% |
| Dec 2025 | $283,400 | 6 | 15 | 41 | 6.8 | 75 | $202,250 | $220,917 | 96.0% |
| Jan 2026 | $280,400 | 4 | 30 | 46 | 11.5 | 102 | $257,500 | $265,000 | 93.0% |
| Feb 2026 | $272,600 | 4 | 22 | 55 | 13.8 | 50 | $269,500 | $256,000 | 96.0% |
| Mar 2026 | $278,700 | 9 | 25 | 58 | 6.4 | 50 | $242,000 | $245,056 | 95.0% |
| Apr 2026 | $274,800 | 8 | 26 | 56 | 7.0 | 57 | $274,250 | $267,288 | 95.0% |
| May 2026 | $272,100 | 9 | 18 | 54 | 6.0 | 38 | $245,000 | $237,322 | 95.0% |
| Jun 2026 | $265,100 | 7 | 18 | 46 | 6.6 | 75 | $245,000 | $256,200 | 98.0% |
| Jul 2026 | $263,400 | 8 | 23 | 50 | 6.3 | 47 | $246,500 | $244,188 | 95.0% |
| Aug 2026 | $262,000 | 9 | 23 | 50 | 5.6 | 40 | $230,000 | $248,217 | 94.0% |
| Sep 2026 | $260,000 | 7 | 19 | 50 | 7.1 | 56 | $235,000 | $239,571 | 94.0% |
Source: Calgary Real Estate Board (CREB®) monthly statistics. Benchmark price is the typical price of a home in the area. Median and average prices are for homes that sold in the month. Figures can be revised.
Skyview Ranch is one of northeast Calgary's newer communities, growing rapidly since its early development and now home to more than 10,000 residents. Bordered by Metis Trail and just minutes from the Stoney Trail ring road, it offers an easy 20-minute commute downtown and a 7-minute drive to Calgary International Airport. The community was built with families in mind, with playgrounds and green space woven throughout, and Skyview Ranch Elementary/Middle School serving local students. Everyday shopping is close by at Skyview Station Shopping Centre, with CrossIron Mills and Costco just a 10-minute drive away. Residents also have quick access to the Genesis Centre of Community Wellness in neighbouring Saddle Ridge for recreation and fitness. With a mix of single-family homes, townhomes, and condos, Skyview Ranch suits a range of budgets and lifestyles for buyers wanting a modern northeast Calgary community.

Sign Up For A Free Calgary Real Estate Market Report!
Be a smart homeowner. Whether you are looking to buy or looking to sell, knowing your market makes a difference in your pocket. By signing up, you will receive a customized report, every month. This report gives you a 12-month summary with exclusive insights into Calgary real estate and your neighbourhood of choice.
The power of this report gives you special insights into information like average and median prices. Get to know what has sold and at what price in your neighborhood, and see where they are on Google Maps!
Get Your Free Market Report- All Listings
- $100,000 - $200,000
- $200,000 - $300,000
- $300,000 - $400,000
- $400,000 - $500,000
- $500,000 - $600,000
- $600,000 - $700,000
- $700,000 - $800,000
- $900,000 - $1,000,000
- Over $1,000,000

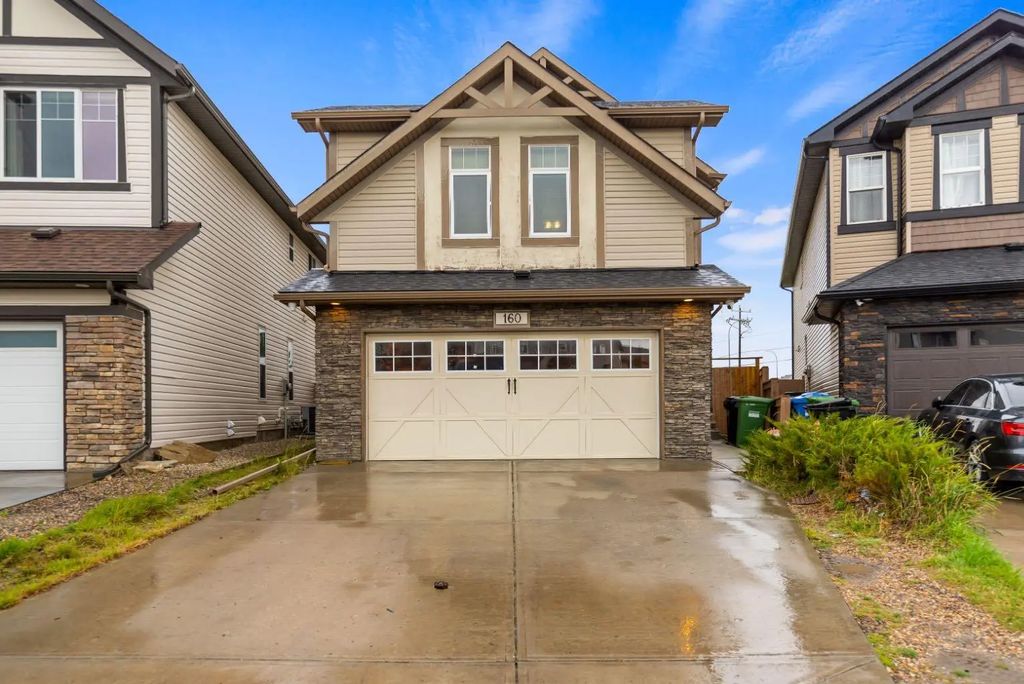
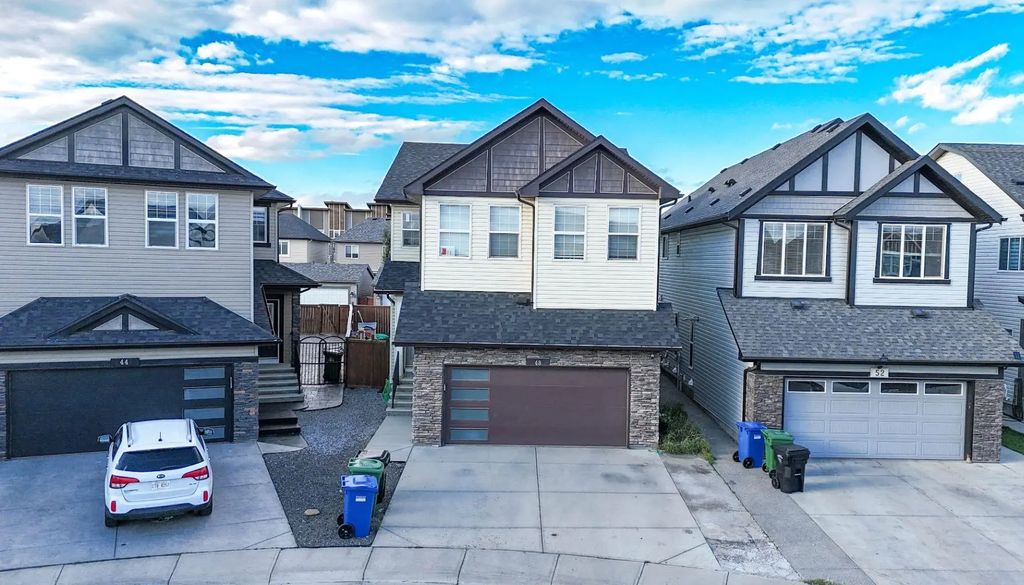
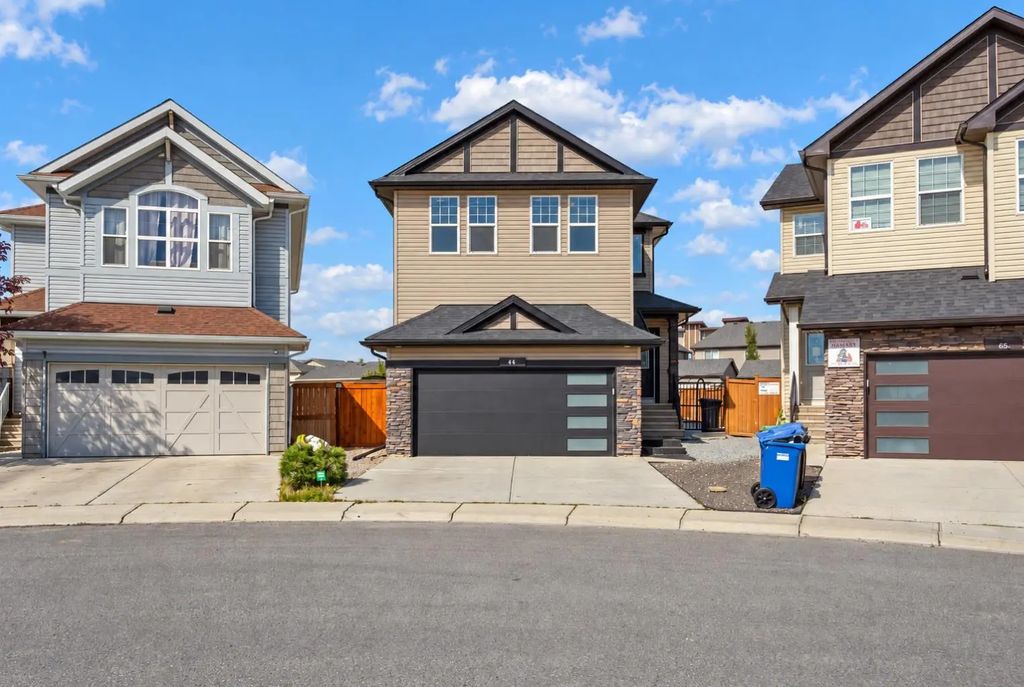

Frequently Asked Questions About Skyview Ranch
How established is Skyview Ranch as a community?
Skyview Ranch is a newer northeast Calgary community that grew quickly, more than doubling in population between 2013 and 2017 to over 10,000 residents. It's now a fully active, family-oriented neighbourhood bordered by Redstone and Cityscape.
What's the commute like from Skyview Ranch?
The community sits just minutes from the Stoney Trail ring road, putting downtown Calgary about a 20-minute drive away and the airport around 7 minutes away. Country Hills Boulevard runs through the community for east-west access.
What types of homes are available in Skyview Ranch?
Skyview Ranch offers a mix of single-family homes, townhomes, and condos, giving buyers options across different price points. Single-family new builds have largely sold out, so much of the current inventory is resale and attached housing.