
Marlborough NE Calgary MLS® Listings
Houses, Condos and Real Estate For Sale.
Marlborough Market Snapshot
September 2026 · all residential property types
In September 2026, the benchmark price for Marlborough was $490,800, down 4.9% from September last year. 4 homes sold (down 60%), 13 new listings came on the market (up 30%), and there were 25 active listings at month end (up 25%). Among homes that sold, the median sale price was $475,000 (down 16.3%) and the average sale price was $471,625 (down 13.1%), and homes sold for 97.0% of their asking price. That is 6.3 months of supply, and homes spent 81 days on the market (up 42 days). Figures cover all residential property types.
View the numbers
| Measure | September 2026 | September last year |
|---|---|---|
| Benchmark price | $490,800 | $516,200 |
| Median price | $475,000 | $567,500 |
| Average price | $471,625 | $542,750 |
| Sold vs asking | 97.0% | 97.0% |
| Homes sold | 4 | 10 |
| New listings | 13 | 10 |
| Active listings | 25 | 20 |
| Months of supply | 6.3 | 2.0 |
| Days on market | 81 | 39 |
12-month trend
View the monthly numbers
| Month | Benchmark price | Sold | New listings | Active listings | Months of supply | Days on market | Median price | Average price | Sold vs asking |
|---|---|---|---|---|---|---|---|---|---|
| Oct 2025 | $513,100 | 11 | 15 | 18 | 1.6 | 41 | $495,000 | $503,273 | 96.0% |
| Nov 2025 | $499,400 | 7 | 6 | 14 | 2.0 | 39 | $443,000 | $472,071 | 100.0% |
| Dec 2025 | $489,600 | 1 | 8 | 17 | 17.0 | 8 | $185,000 | $185,000 | 84.0% |
| Jan 2026 | $486,200 | 5 | 11 | 20 | 4.0 | 22 | $424,000 | $432,450 | 100.0% |
| Feb 2026 | $485,300 | 7 | 6 | 15 | 2.1 | 28 | $465,000 | $475,643 | 98.0% |
| Mar 2026 | $482,200 | 9 | 8 | 9 | 1.0 | 53 | $505,000 | $496,698 | 96.0% |
| Apr 2026 | $482,000 | 6 | 14 | 13 | 2.2 | 33 | $489,500 | $499,667 | 101.0% |
| May 2026 | $488,800 | 6 | 18 | 22 | 3.7 | 16 | $515,000 | $509,667 | 96.0% |
| Jun 2026 | $482,300 | 7 | 24 | 31 | 4.4 | 37 | $525,000 | $509,000 | 97.0% |
| Jul 2026 | $494,900 | 8 | 10 | 29 | 3.6 | 23 | $506,000 | $497,312 | 97.0% |
| Aug 2026 | $497,500 | 9 | 11 | 25 | 2.8 | 35 | $520,000 | $520,889 | 97.0% |
| Sep 2026 | $490,800 | 4 | 13 | 25 | 6.3 | 81 | $475,000 | $471,625 | 97.0% |
September 2026 · detached homes
In September 2026, the benchmark price for Marlborough was $534,400, down 4.3% from September last year. 3 homes sold (down 67%), 12 new listings came on the market (up 33%), and there were 20 active listings at month end (up 25%). Among homes that sold, the median sale price was $476,000 (down 16.5%) and the average sale price was $525,000 (down 7.0%), and homes sold for 97.0% of their asking price. That is 6.7 months of supply, and homes spent 94 days on the market (up 58 days). Figures cover detached homes.
View the numbers
| Measure | September 2026 | September last year |
|---|---|---|
| Benchmark price | $534,400 | $558,400 |
| Median price | $476,000 | $570,000 |
| Average price | $525,000 | $564,722 |
| Sold vs asking | 97.0% | 96.0% |
| Homes sold | 3 | 9 |
| New listings | 12 | 9 |
| Active listings | 20 | 16 |
| Months of supply | 6.7 | 1.8 |
| Days on market | 94 | 36 |
12-month trend
View the monthly numbers
| Month | Benchmark price | Sold | New listings | Active listings | Months of supply | Days on market | Median price | Average price | Sold vs asking |
|---|---|---|---|---|---|---|---|---|---|
| Oct 2025 | $554,000 | 10 | 14 | 14 | 1.4 | 38 | $517,500 | $523,600 | 96.0% |
| Nov 2025 | $538,100 | 6 | 5 | 12 | 2.0 | 40 | $475,000 | $476,917 | 100.0% |
| Dec 2025 | $528,400 | 0 | 4 | 12 | n/a | n/a | n/a | n/a | n/a |
| Jan 2026 | $526,700 | 3 | 7 | 13 | 4.3 | 16 | $480,000 | $461,783 | 100.0% |
| Feb 2026 | $528,400 | 4 | 4 | 10 | 2.5 | 26 | $526,500 | $553,250 | 99.0% |
| Mar 2026 | $524,700 | 8 | 8 | 6 | 0.8 | 43 | $530,000 | $529,661 | 97.0% |
| Apr 2026 | $525,200 | 6 | 12 | 10 | 1.7 | 33 | $489,500 | $499,667 | 101.0% |
| May 2026 | $533,200 | 6 | 14 | 16 | 2.7 | 16 | $515,000 | $509,667 | 96.0% |
| Jun 2026 | $522,900 | 7 | 17 | 21 | 3.0 | 37 | $525,000 | $509,000 | 97.0% |
| Jul 2026 | $539,000 | 6 | 8 | 20 | 3.3 | 22 | $512,500 | $559,750 | 97.0% |
| Aug 2026 | $539,100 | 7 | 10 | 18 | 2.6 | 30 | $565,000 | $559,857 | 97.0% |
| Sep 2026 | $534,400 | 3 | 12 | 20 | 6.7 | 94 | $476,000 | $525,000 | 97.0% |
Source: Calgary Real Estate Board (CREB®) monthly statistics. Benchmark price is the typical price of a home in the area. Median and average prices are for homes that sold in the month. Figures can be revised.
Marlborough is one of northeast Calgary's established communities, developed in 1967 and named for Marlborough in Wiltshire, England. Bordered by 16 Avenue NE (the Trans-Canada Highway), 52 Street NE, Memorial Drive, and 36 Street NE, the community offers a central NE location with straightforward access to downtown. Marlborough LRT station, one of the original CTrain stops on the Blue Line since 1985, sits right in the community, and Marlborough Mall anchors the southwest corner with everyday shopping. Marlborough is known for its cultural diversity, with roughly half of residents being immigrants, and it offers mature trees, established homes, and a range of housing types typical of a late-1960s Calgary neighbourhood. For buyers wanting an affordable, transit-connected community with quick downtown access, Marlborough is worth a look.

Sign Up For A Free Calgary Real Estate Market Report!
Be a smart homeowner. Whether you are looking to buy or looking to sell, knowing your market makes a difference in your pocket. By signing up, you will receive a customized report, every month. This report gives you a 12-month summary with exclusive insights into Calgary real estate and your neighbourhood of choice.
The power of this report gives you special insights into information like average and median prices. Get to know what has sold and at what price in your neighborhood, and see where they are on Google Maps!
Get Your Free Market Report- All Listings
- Under $100,000
- $100,000 - $200,000
- $200,000 - $300,000
- $300,000 - $400,000
- $400,000 - $500,000
- $500,000 - $600,000
- $600,000 - $700,000
- $900,000 - $1,000,000



Frequently Asked Questions About Marlborough
What transit options does Marlborough offer?
Marlborough has its own CTrain stop, Marlborough station, which has served the Blue Line since 1985, giving residents a direct rail connection into downtown Calgary. Memorial Drive also runs along the community's southern edge for a quick drive downtown.
Is Marlborough an amenity-rich community?
Yes - Marlborough Mall sits in the southwest corner of the community with everyday shopping and services, and the LRT station is within walking distance for many residents. As an established late-1960s neighbourhood, most homes are close to schools, parks, and transit.
What kind of housing will I find in Marlborough?
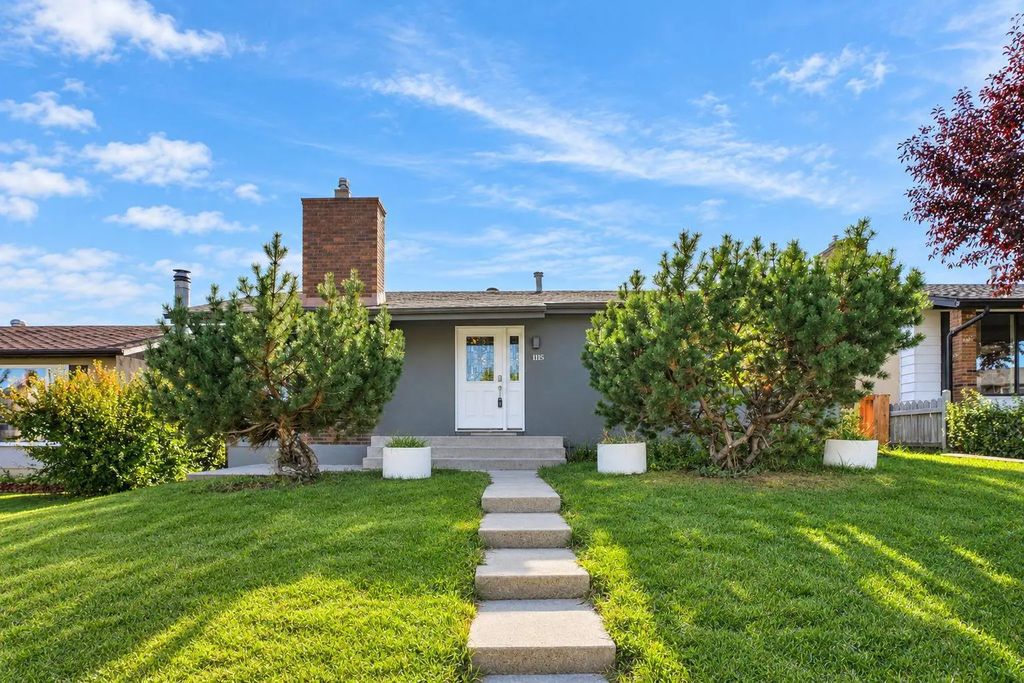
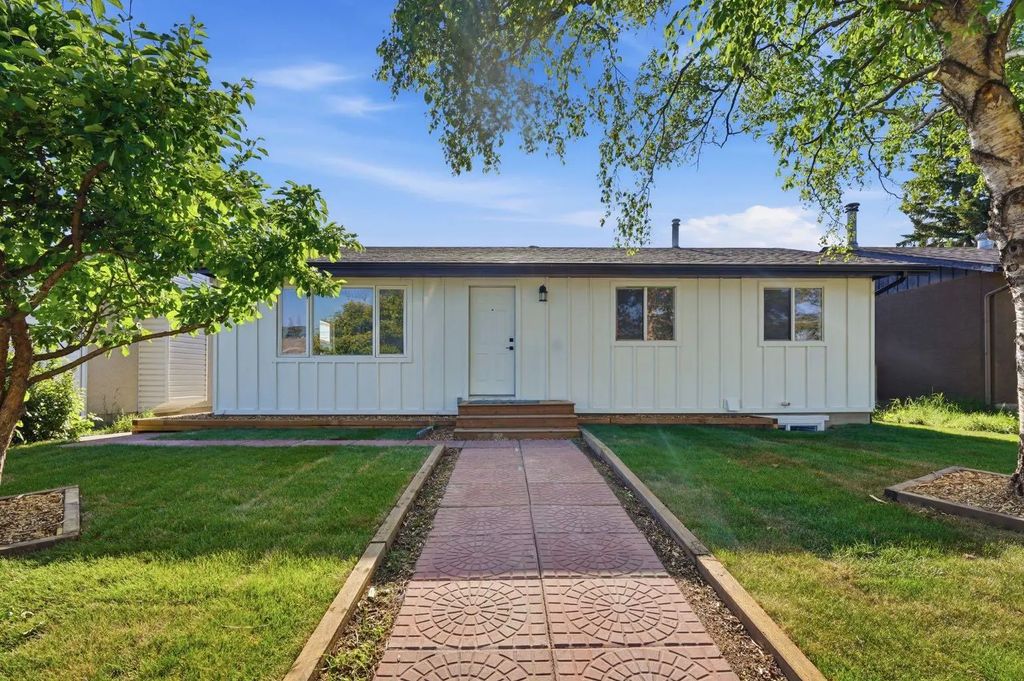
Marlborough was developed starting in 1967, so buyers will find mostly mature single-family homes alongside some multi-family and rental options, reflecting the community's diverse, long-established character. It's a good option for buyers looking for value in a centrally located NE community.