
Coral Springs NE Calgary MLS® Listings
Houses, Condos and Real Estate For Sale.
Coral Springs Market Snapshot
September 2026 · all residential property types
In September 2026, the benchmark price for Coral Springs was $648,900, down 7.6% from September last year. 3 homes sold (down 57%), 8 new listings came on the market (up 60%), and there were 12 active listings at month end (down 8%). Among homes that sold, the median sale price was $700,000 (down 2.8%) and the average sale price was $855,500 (up 18.5%), and homes sold for 95.0% of their asking price. That is 4.0 months of supply, and homes spent 39 days on the market (down 8 days). Figures cover all residential property types.
View the numbers
| Measure | September 2026 | September last year |
|---|---|---|
| Benchmark price | $648,900 | $702,600 |
| Median price | $700,000 | $720,000 |
| Average price | $855,500 | $722,071 |
| Sold vs asking | 95.0% | 96.0% |
| Homes sold | 3 | 7 |
| New listings | 8 | 5 |
| Active listings | 12 | 13 |
| Months of supply | 4.0 | 1.9 |
| Days on market | 39 | 47 |
12-month trend
View the monthly numbers
| Month | Benchmark price | Sold | New listings | Active listings | Months of supply | Days on market | Median price | Average price | Sold vs asking |
|---|---|---|---|---|---|---|---|---|---|
| Oct 2025 | $711,100 | 0 | 7 | 14 | n/a | n/a | n/a | n/a | n/a |
| Nov 2025 | $697,900 | 2 | 3 | 11 | 5.5 | 22 | $655,000 | $655,000 | 98.0% |
| Dec 2025 | $697,100 | 0 | 3 | 11 | n/a | n/a | n/a | n/a | n/a |
| Jan 2026 | $691,600 | 3 | 6 | 9 | 3.0 | 67 | $675,000 | $648,333 | 95.0% |
| Feb 2026 | $677,800 | 1 | 8 | 12 | 12.0 | 26 | $579,000 | $579,000 | 94.0% |
| Mar 2026 | $663,900 | 1 | 6 | 16 | 16.0 | 52 | $604,000 | $604,000 | 96.0% |
| Apr 2026 | $644,100 | 4 | 5 | 15 | 3.8 | 49 | $674,000 | $594,500 | 96.0% |
| May 2026 | $672,800 | 3 | 8 | 17 | 5.7 | 45 | $635,000 | $715,000 | 94.0% |
| Jun 2026 | $669,500 | 6 | 14 | 20 | 3.3 | 73 | $715,000 | $725,083 | 96.0% |
| Jul 2026 | $657,700 | 3 | 4 | 17 | 5.7 | 71 | $725,000 | $684,167 | 95.0% |
| Aug 2026 | $654,000 | 2 | 4 | 11 | 5.5 | 44 | $644,500 | $644,500 | 95.0% |
| Sep 2026 | $648,900 | 3 | 8 | 12 | 4.0 | 39 | $700,000 | $855,500 | 95.0% |
September 2026 · detached homes
In September 2026, the benchmark price for Coral Springs was $648,900, down 7.6% from September last year. 3 homes sold (down 57%), 8 new listings came on the market (up 100%), and there were 11 active listings at month end (down 8%). Among homes that sold, the median sale price was $700,000 (down 2.8%) and the average sale price was $855,500 (up 18.5%), and homes sold for 95.0% of their asking price. That is 3.7 months of supply, and homes spent 39 days on the market (down 8 days). Figures cover detached homes.
View the numbers
| Measure | September 2026 | September last year |
|---|---|---|
| Benchmark price | $648,900 | $702,600 |
| Median price | $700,000 | $720,000 |
| Average price | $855,500 | $722,071 |
| Sold vs asking | 95.0% | 96.0% |
| Homes sold | 3 | 7 |
| New listings | 8 | 4 |
| Active listings | 11 | 12 |
| Months of supply | 3.7 | 1.7 |
| Days on market | 39 | 47 |
12-month trend
View the monthly numbers
| Month | Benchmark price | Sold | New listings | Active listings | Months of supply | Days on market | Median price | Average price | Sold vs asking |
|---|---|---|---|---|---|---|---|---|---|
| Oct 2025 | $711,100 | 0 | 7 | 13 | n/a | n/a | n/a | n/a | n/a |
| Nov 2025 | $697,900 | 2 | 2 | 9 | 4.5 | 22 | $655,000 | $655,000 | 98.0% |
| Dec 2025 | $697,100 | 0 | 3 | 10 | n/a | n/a | n/a | n/a | n/a |
| Jan 2026 | $691,600 | 2 | 5 | 8 | 4.0 | 78 | $800,000 | $800,000 | 97.0% |
| Feb 2026 | $677,800 | 1 | 7 | 10 | 10.0 | 26 | $579,000 | $579,000 | 94.0% |
| Mar 2026 | $663,900 | 1 | 6 | 14 | 14.0 | 52 | $604,000 | $604,000 | 96.0% |
| Apr 2026 | $644,100 | 3 | 5 | 14 | 4.7 | 43 | $675,000 | $681,000 | 96.0% |
| May 2026 | $672,800 | 3 | 8 | 16 | 5.3 | 45 | $635,000 | $715,000 | 94.0% |
| Jun 2026 | $669,500 | 6 | 14 | 19 | 3.2 | 73 | $715,000 | $725,083 | 96.0% |
| Jul 2026 | $657,700 | 3 | 4 | 16 | 5.3 | 71 | $725,000 | $684,167 | 95.0% |
| Aug 2026 | $654,000 | 2 | 4 | 10 | 5.0 | 44 | $644,500 | $644,500 | 95.0% |
| Sep 2026 | $648,900 | 3 | 8 | 11 | 3.7 | 39 | $700,000 | $855,500 | 95.0% |
Source: Calgary Real Estate Board (CREB®) monthly statistics. Benchmark price is the typical price of a home in the area. Median and average prices are for homes that sold in the month. Figures can be revised.
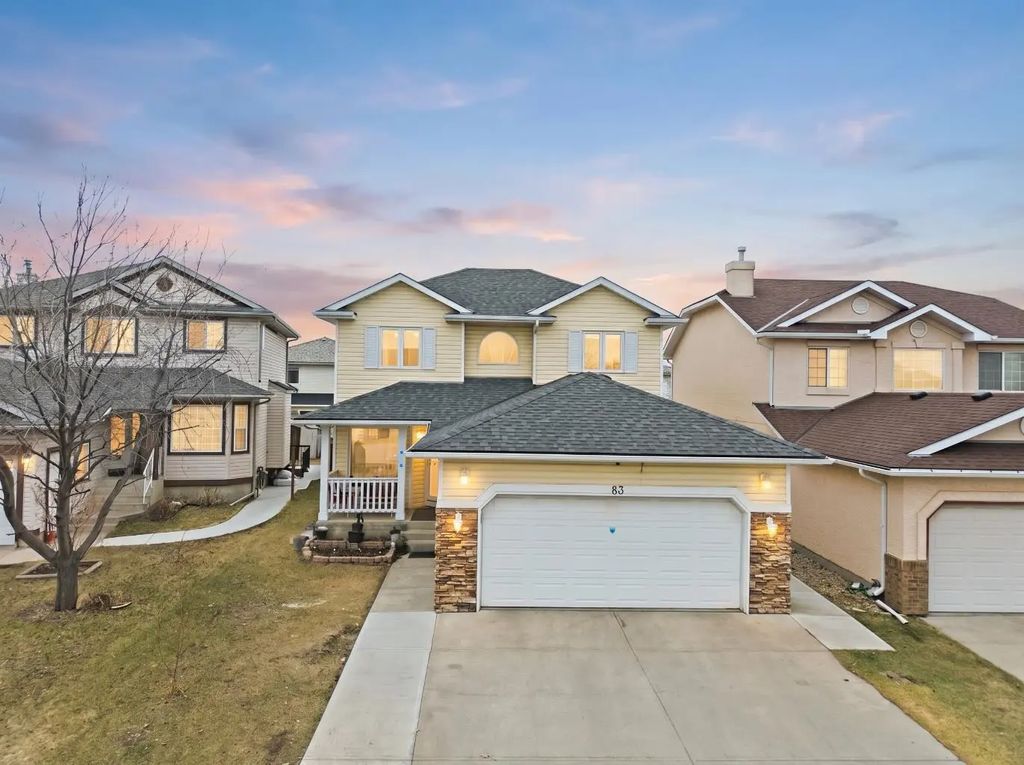
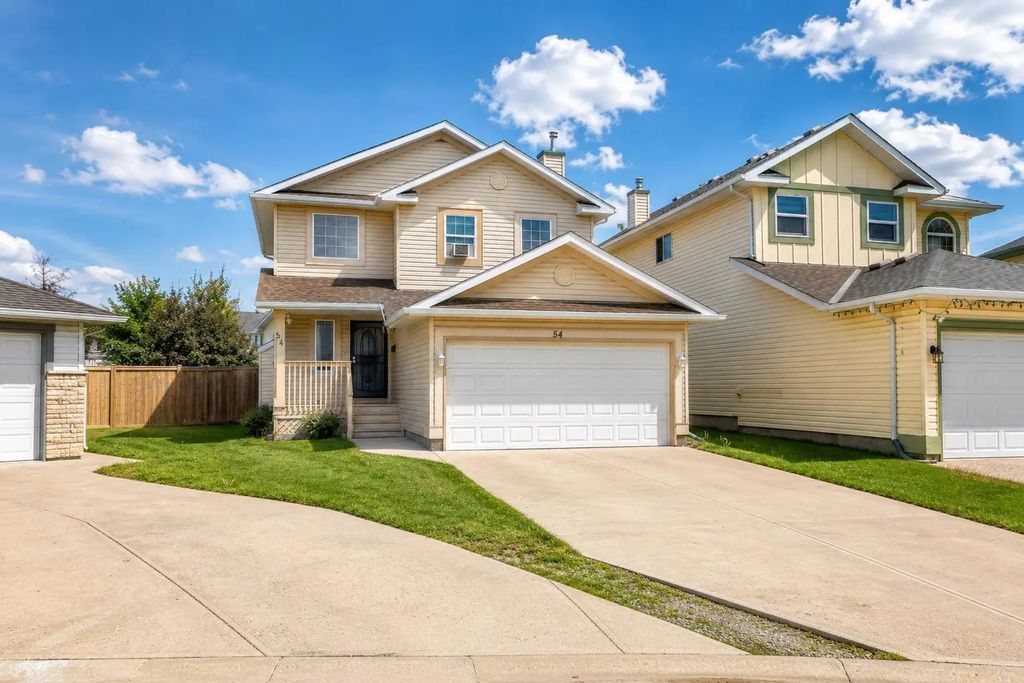
Coral Springs has been one of northeast Calgary's most sought-after lake communities since it was established in 1991. Built around a Californian-themed layout, the neighbourhood centres on a private lake, where residents swim, boat, and fish, with paved pathways along the shoreline connecting to the city's wider pathway network. Homes here are almost entirely single-family detached, and the community is consistently noted as one of the wealthiest in NE Calgary. Families are close to schools such as Monsignor A.J. Hetherington and Grant MacEwan School, and the Don Hartman Northeast Sportsplex serves as a hub for community events and recreation. Getting downtown is straightforward too, with the Saddletowne C-Train station about a ten-minute walk away and Sunridge Mall a short drive for larger shopping trips.

Sign Up For A Free Calgary Real Estate Market Report!
Be a smart homeowner. Whether you are looking to buy or looking to sell, knowing your market makes a difference in your pocket. By signing up, you will receive a customized report, every month. This report gives you a 12-month summary with exclusive insights into Calgary real estate and your neighbourhood of choice.
The power of this report gives you special insights into information like average and median prices. Get to know what has sold and at what price in your neighborhood, and see where they are on Google Maps!
Get Your Free Market ReportSearch Coral Springs NE Calgary Real Estate Listings - Homes, Condos and Townhouses For Sale
- All Listings
- $300,000 - $400,000
- $400,000 - $500,000
- $500,000 - $600,000
- $600,000 - $700,000
- $700,000 - $800,000







Frequently Asked Questions About Coral Springs
What makes Coral Springs unique among NE Calgary communities?
Coral Springs is built around a private, Californian-themed lake at its centre, where residents can swim, boat and fish through the summer. It's consistently noted as one of the wealthiest communities in northeast Calgary, with homes that are almost entirely single-family detached.
What schools are near Coral Springs?
Families in Coral Springs are close to schools including Monsignor A.J. Hetherington and Grant MacEwan School, both within a couple of kilometres of the community. The Don Hartman Northeast Sportsplex also hosts youth and family programming through the community association.
Is Coral Springs well connected to transit and shopping?
Yes, the Saddletowne C-Train station is roughly 1.7 kilometres away, and several bus routes run through the community. For larger shopping trips, Sunridge Mall is about five kilometres from Coral Springs.