
Monterey Park NE Calgary MLS® Listings
Houses, Condos and Real Estate For Sale.
Monterey Park Market Snapshot
September 2026 · all residential property types
In September 2026, the benchmark price for Monterey Park was $499,300, down 6.5% from September last year. 9 homes sold (unchanged), 21 new listings came on the market (up 110%), and there were 39 active listings at month end (up 77%). Among homes that sold, the median sale price was $520,000 (up 9.5%) and the average sale price was $506,822 (up 0.7%), and homes sold for 96.0% of their asking price. That is 4.3 months of supply, and homes spent 46 days on the market (up 6 days). Figures cover all residential property types.
View the numbers
| Measure | September 2026 | September last year |
|---|---|---|
| Benchmark price | $499,300 | $533,900 |
| Median price | $520,000 | $475,000 |
| Average price | $506,822 | $503,222 |
| Sold vs asking | 96.0% | 99.0% |
| Homes sold | 9 | 9 |
| New listings | 21 | 10 |
| Active listings | 39 | 22 |
| Months of supply | 4.3 | 2.4 |
| Days on market | 46 | 40 |
12-month trend
View the monthly numbers
| Month | Benchmark price | Sold | New listings | Active listings | Months of supply | Days on market | Median price | Average price | Sold vs asking |
|---|---|---|---|---|---|---|---|---|---|
| Oct 2025 | $524,700 | 6 | 18 | 28 | 4.7 | 38 | $533,750 | $552,583 | 98.0% |
| Nov 2025 | $553,900 | 5 | 9 | 23 | 4.6 | 50 | $630,000 | $530,100 | 96.0% |
| Dec 2025 | $516,800 | 7 | 3 | 12 | 1.7 | 57 | $450,000 | $403,607 | 96.0% |
| Jan 2026 | $539,000 | 5 | 6 | 13 | 2.6 | 95 | $485,000 | $496,900 | 96.0% |
| Feb 2026 | $547,700 | 4 | 14 | 20 | 5.0 | 58 | $432,550 | $443,275 | 96.0% |
| Mar 2026 | $553,200 | 5 | 14 | 23 | 4.6 | 37 | $399,000 | $419,600 | 95.0% |
| Apr 2026 | $518,200 | 5 | 15 | 22 | 4.4 | 55 | $435,000 | $434,400 | 97.0% |
| May 2026 | $519,600 | 5 | 19 | 27 | 5.4 | 28 | $468,000 | $472,800 | 95.0% |
| Jun 2026 | $516,400 | 7 | 12 | 27 | 3.9 | 28 | $503,000 | $544,500 | 96.0% |
| Jul 2026 | $532,800 | 4 | 21 | 35 | 8.8 | 62 | $457,500 | $460,500 | 97.0% |
| Aug 2026 | $523,000 | 7 | 17 | 36 | 5.1 | 34 | $520,000 | $521,571 | 97.0% |
| Sep 2026 | $499,300 | 9 | 21 | 39 | 4.3 | 46 | $520,000 | $506,822 | 96.0% |
September 2026 · detached homes
In September 2026, the benchmark price for Monterey Park was $525,800, down 8.0% from September last year. 8 homes sold (up 14%), 19 new listings came on the market (up 138%), and there were 36 active listings at month end (up 100%). Among homes that sold, the median sale price was $522,500 (up 4.7%) and the average sale price was $524,550 (down 1.5%), and homes sold for 96.0% of their asking price. That is 4.5 months of supply, and homes spent 44 days on the market (down 6 days). Figures cover detached homes.
View the numbers
| Measure | September 2026 | September last year |
|---|---|---|
| Benchmark price | $525,800 | $571,600 |
| Median price | $522,500 | $499,000 |
| Average price | $524,550 | $532,714 |
| Sold vs asking | 96.0% | 98.0% |
| Homes sold | 8 | 7 |
| New listings | 19 | 8 |
| Active listings | 36 | 18 |
| Months of supply | 4.5 | 2.6 |
| Days on market | 44 | 50 |
12-month trend
View the monthly numbers
| Month | Benchmark price | Sold | New listings | Active listings | Months of supply | Days on market | Median price | Average price | Sold vs asking |
|---|---|---|---|---|---|---|---|---|---|
| Oct 2025 | $558,800 | 6 | 15 | 21 | 3.5 | 38 | $533,750 | $552,583 | 98.0% |
| Nov 2025 | $593,300 | 4 | 7 | 16 | 4.0 | 56 | $640,000 | $599,000 | 96.0% |
| Dec 2025 | $555,700 | 5 | 2 | 9 | 1.8 | 63 | $492,000 | $484,250 | 97.0% |
| Jan 2026 | $577,900 | 4 | 6 | 11 | 2.8 | 79 | $578,750 | $568,875 | 96.0% |
| Feb 2026 | $589,200 | 2 | 12 | 18 | 9.0 | 60 | $560,000 | $560,000 | 97.0% |
| Mar 2026 | $595,000 | 4 | 11 | 19 | 4.8 | 28 | $436,500 | $465,750 | 96.0% |
| Apr 2026 | $557,200 | 3 | 14 | 19 | 6.3 | 64 | $437,000 | $515,000 | 99.0% |
| May 2026 | $558,300 | 4 | 17 | 24 | 6.0 | 24 | $502,000 | $494,750 | 96.0% |
| Jun 2026 | $552,200 | 7 | 11 | 23 | 3.3 | 28 | $503,000 | $544,500 | 96.0% |
| Jul 2026 | $571,500 | 3 | 20 | 32 | 10.7 | 65 | $475,000 | $528,333 | 97.0% |
| Aug 2026 | $553,500 | 7 | 16 | 33 | 4.7 | 34 | $520,000 | $521,571 | 97.0% |
| Sep 2026 | $525,800 | 8 | 19 | 36 | 4.5 | 44 | $522,500 | $524,550 | 96.0% |
Source: Calgary Real Estate Board (CREB®) monthly statistics. Benchmark price is the typical price of a home in the area. Median and average prices are for homes that sold in the month. Figures can be revised.
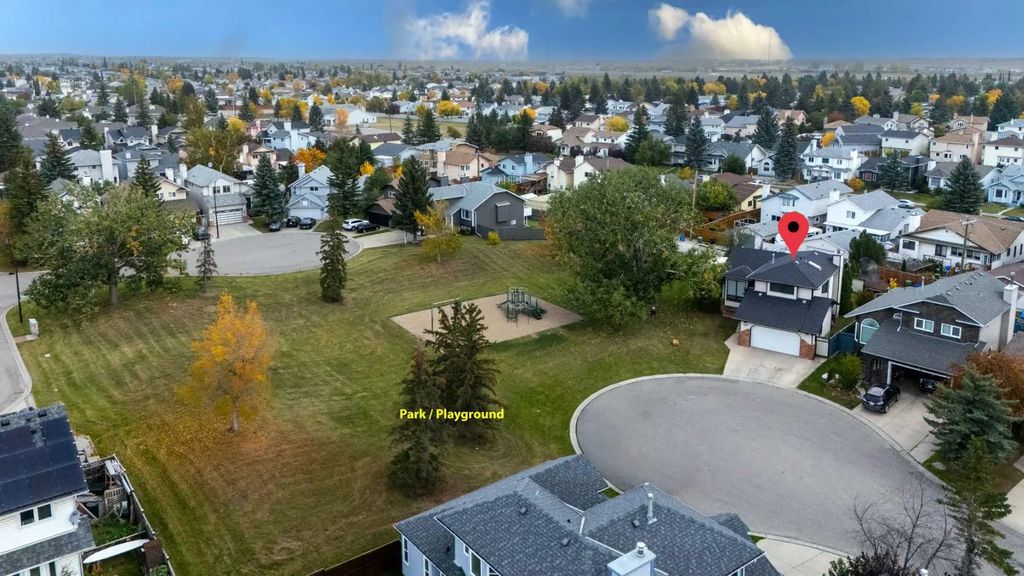
Monterey Park is a northeast Calgary community developed in 1985 and named after Monterey Park, California, which is reflected in its California-inspired street names and architectural style. The community is bounded by McKnight Boulevard, Metis Trail, the Trans-Canada Highway, and 84 Street E, and the Nose Creek regional pathway runs through the area, giving residents access to walking and cycling routes that connect into Calgary's wider pathway network. Families have Monterey Park Elementary School right in the community for K-6 schooling. Housing is predominantly single-family detached, giving Monterey Park a settled, suburban feel, and the community has seen a steady decline in crime rates over the past several years. For buyers wanting an established NE community with pathway access and a neighbourhood school, Monterey Park is worth considering.

Sign Up For A Free Calgary Real Estate Market Report!
Be a smart homeowner. Whether you are looking to buy or looking to sell, knowing your market makes a difference in your pocket. By signing up, you will receive a customized report, every month. This report gives you a 12-month summary with exclusive insights into Calgary real estate and your neighbourhood of choice.
The power of this report gives you special insights into information like average and median prices. Get to know what has sold and at what price in your neighborhood, and see where they are on Google Maps!
Get Your Free Market Report- All Listings
- $100,000 - $200,000
- $200,000 - $300,000
- $300,000 - $400,000
- $400,000 - $500,000
- $500,000 - $600,000
- $600,000 - $700,000
- $700,000 - $800,000


Frequently Asked Questions About Monterey Park
What outdoor recreation is available in Monterey Park?
The Nose Creek regional pathway runs through Monterey Park, giving residents direct access to walking and cycling routes that connect into Calgary's broader pathway network. This makes it a good option for buyers who want outdoor access without leaving the neighbourhood.
Is Monterey Park a good community for families with young kids?
Yes - Monterey Park Elementary School serves K-6 students directly within the community, and the neighbourhood is predominantly single-family homes on quiet, California-themed streets. It's an established, settled community that suits families looking to put down roots.
How safe is Monterey Park?
Monterey Park's crime rate has declined steadily in recent years, dropping from about 1.6 per 100 population in 2018 to 1.1 in 2023. As always, buyers should review current, block-level crime statistics when comparing NE communities.