
Mayland Heights NE Calgary MLS® Listings
Houses, Condos and Real Estate For Sale.
Northeast Calgary Market Snapshot
Mayland Heights had too few sales in September 2026 for community-level statistics, so this snapshot shows Northeast Calgary, the district it belongs to.
September 2026 · all residential property types
In September 2026, the benchmark price for Northeast Calgary was $461,200, down 6.1% from September last year. 129 homes sold (down 32%), 370 new listings came on the market (down 25%), and there were 834 active listings at month end (down 18%). Among homes that sold, the median sale price was $482,500 (down 9.0%) and the average sale price was $496,243 (down 3.6%), and homes sold for 96.0% of their asking price. That is 6.5 months of supply, and homes spent 49 days on the market (up 7 days). Figures cover all residential property types.
View the numbers
| Measure | September 2026 | September last year |
|---|---|---|
| Benchmark price | $461,200 | $491,200 |
| Median price | $482,500 | $530,000 |
| Average price | $496,243 | $514,569 |
| Sold vs asking | 96.0% | 97.0% |
| Homes sold | 129 | 191 |
| New listings | 370 | 496 |
| Active listings | 834 | 1,012 |
| Months of supply | 6.5 | 5.3 |
| Days on market | 49 | 42 |
12-month trend
View the monthly numbers
| Month | Benchmark price | Sold | New listings | Active listings | Months of supply | Days on market | Median price | Average price | Sold vs asking |
|---|---|---|---|---|---|---|---|---|---|
| Oct 2025 | $485,000 | 167 | 417 | 952 | 5.7 | 45 | $495,000 | $489,601 | 97.0% |
| Nov 2025 | $482,100 | 164 | 315 | 815 | 5.0 | 50 | $507,500 | $496,291 | 97.0% |
| Dec 2025 | $473,200 | 117 | 210 | 627 | 5.4 | 50 | $485,000 | $480,130 | 96.0% |
| Jan 2026 | $472,100 | 149 | 344 | 610 | 4.1 | 61 | $515,000 | $512,391 | 97.0% |
| Feb 2026 | $471,200 | 116 | 354 | 702 | 6.1 | 44 | $488,750 | $494,531 | 97.0% |
| Mar 2026 | $473,800 | 159 | 399 | 770 | 4.8 | 42 | $483,000 | $481,245 | 97.0% |
| Apr 2026 | $468,600 | 173 | 437 | 810 | 4.7 | 44 | $495,000 | $492,241 | 97.0% |
| May 2026 | $467,800 | 205 | 502 | 913 | 4.5 | 44 | $481,111 | $480,165 | 97.0% |
| Jun 2026 | $465,600 | 200 | 444 | 907 | 4.5 | 44 | $486,250 | $484,064 | 97.0% |
| Jul 2026 | $466,400 | 171 | 402 | 911 | 5.3 | 43 | $470,000 | $455,708 | 97.0% |
| Aug 2026 | $464,200 | 158 | 390 | 851 | 5.4 | 45 | $485,000 | $473,091 | 97.0% |
| Sep 2026 | $461,200 | 129 | 370 | 834 | 6.5 | 49 | $482,500 | $496,243 | 96.0% |
September 2026 · detached homes
In September 2026, the benchmark price for Northeast Calgary was $556,600, down 6.0% from September last year. 88 homes sold (down 27%), 235 new listings came on the market (down 16%), and there were 496 active listings at month end (down 8%). Among homes that sold, the median sale price was $547,450 (down 9.1%) and the average sale price was $566,228 (down 5.6%), and homes sold for 97.0% of their asking price. That is 5.6 months of supply, and homes spent 44 days on the market (up 6 days). Figures cover detached homes.
View the numbers
| Measure | September 2026 | September last year |
|---|---|---|
| Benchmark price | $556,600 | $592,200 |
| Median price | $547,450 | $602,500 |
| Average price | $566,228 | $599,809 |
| Sold vs asking | 97.0% | 98.0% |
| Homes sold | 88 | 120 |
| New listings | 235 | 279 |
| Active listings | 496 | 537 |
| Months of supply | 5.6 | 4.5 |
| Days on market | 44 | 38 |
12-month trend
View the monthly numbers
| Month | Benchmark price | Sold | New listings | Active listings | Months of supply | Days on market | Median price | Average price | Sold vs asking |
|---|---|---|---|---|---|---|---|---|---|
| Oct 2025 | $586,600 | 103 | 245 | 514 | 5.0 | 38 | $565,000 | $571,367 | 97.0% |
| Nov 2025 | $584,000 | 102 | 171 | 427 | 4.2 | 47 | $554,750 | $580,685 | 97.0% |
| Dec 2025 | $573,700 | 73 | 114 | 330 | 4.5 | 49 | $535,100 | $561,667 | 97.0% |
| Jan 2026 | $573,400 | 96 | 176 | 314 | 3.3 | 60 | $575,000 | $582,620 | 97.0% |
| Feb 2026 | $572,900 | 64 | 183 | 348 | 5.4 | 38 | $574,250 | $585,219 | 97.0% |
| Mar 2026 | $574,800 | 93 | 220 | 386 | 4.2 | 41 | $558,000 | $564,190 | 97.0% |
| Apr 2026 | $565,100 | 101 | 237 | 411 | 4.1 | 45 | $566,000 | $587,625 | 98.0% |
| May 2026 | $563,900 | 122 | 326 | 509 | 4.2 | 38 | $552,500 | $562,234 | 97.0% |
| Jun 2026 | $560,700 | 123 | 260 | 510 | 4.2 | 41 | $575,000 | $572,418 | 97.0% |
| Jul 2026 | $563,900 | 96 | 243 | 520 | 5.4 | 41 | $531,250 | $543,967 | 97.0% |
| Aug 2026 | $560,500 | 93 | 252 | 498 | 5.4 | 39 | $549,000 | $561,133 | 98.0% |
| Sep 2026 | $556,600 | 88 | 235 | 496 | 5.6 | 44 | $547,450 | $566,228 | 97.0% |
September 2026 · semi-detached homes
In September 2026, the benchmark price for Northeast Calgary was $416,500, down 6.0% from September last year. 9 homes sold (down 61%), 33 new listings came on the market (down 37%), and there were 71 active listings at month end (down 26%). Among homes that sold, the median sale price was $423,000 (down 9.0%) and the average sale price was $426,944 (down 5.0%), and homes sold for 95.0% of their asking price. That is 7.9 months of supply, and homes spent 59 days on the market (up 22 days). Figures cover semi-detached homes.
View the numbers
| Measure | September 2026 | September last year |
|---|---|---|
| Benchmark price | $416,500 | $443,200 |
| Median price | $423,000 | $465,000 |
| Average price | $426,944 | $449,400 |
| Sold vs asking | 95.0% | 98.0% |
| Homes sold | 9 | 23 |
| New listings | 33 | 52 |
| Active listings | 71 | 96 |
| Months of supply | 7.9 | 4.2 |
| Days on market | 59 | 37 |
12-month trend
View the monthly numbers
| Month | Benchmark price | Sold | New listings | Active listings | Months of supply | Days on market | Median price | Average price | Sold vs asking |
|---|---|---|---|---|---|---|---|---|---|
| Oct 2025 | $438,600 | 20 | 46 | 87 | 4.4 | 43 | $470,000 | $482,700 | 97.0% |
| Nov 2025 | $440,500 | 15 | 34 | 86 | 5.7 | 33 | $445,000 | $462,667 | 98.0% |
| Dec 2025 | $429,200 | 10 | 22 | 65 | 6.5 | 54 | $496,500 | $475,100 | 97.0% |
| Jan 2026 | $434,100 | 19 | 32 | 52 | 2.7 | 54 | $482,500 | $489,600 | 97.0% |
| Feb 2026 | $435,500 | 20 | 42 | 61 | 3.1 | 50 | $421,750 | $438,075 | 96.0% |
| Mar 2026 | $435,900 | 21 | 37 | 64 | 3.1 | 36 | $418,000 | $437,429 | 98.0% |
| Apr 2026 | $425,500 | 20 | 57 | 78 | 3.9 | 38 | $427,250 | $450,875 | 97.0% |
| May 2026 | $422,900 | 23 | 46 | 83 | 3.6 | 35 | $452,500 | $452,011 | 97.0% |
| Jun 2026 | $422,900 | 18 | 41 | 81 | 4.5 | 31 | $462,000 | $457,167 | 97.0% |
| Jul 2026 | $427,600 | 23 | 43 | 81 | 3.5 | 45 | $442,000 | $442,587 | 97.0% |
| Aug 2026 | $423,300 | 16 | 32 | 74 | 4.6 | 45 | $411,750 | $440,419 | 97.0% |
| Sep 2026 | $416,500 | 9 | 33 | 71 | 7.9 | 59 | $423,000 | $426,944 | 95.0% |
September 2026 · row and townhouse homes
In September 2026, the benchmark price for Northeast Calgary was $326,100, down 11.9% from September last year. 24 homes sold (down 17%), 59 new listings came on the market (down 37%), and there were 144 active listings at month end (down 32%). Among homes that sold, the median sale price was $357,500 (down 3.1%) and the average sale price was $353,199 (down 6.7%), and homes sold for 96.0% of their asking price. That is 6.0 months of supply, and homes spent 62 days on the market (up 10 days). Figures cover row and townhouse homes.
View the numbers
| Measure | September 2026 | September last year |
|---|---|---|
| Benchmark price | $326,100 | $370,000 |
| Median price | $357,500 | $369,000 |
| Average price | $353,199 | $378,414 |
| Sold vs asking | 96.0% | 97.0% |
| Homes sold | 24 | 29 |
| New listings | 59 | 94 |
| Active listings | 144 | 211 |
| Months of supply | 6.0 | 7.3 |
| Days on market | 62 | 52 |
12-month trend
View the monthly numbers
| Month | Benchmark price | Sold | New listings | Active listings | Months of supply | Days on market | Median price | Average price | Sold vs asking |
|---|---|---|---|---|---|---|---|---|---|
| Oct 2025 | $360,600 | 21 | 65 | 188 | 9.0 | 52 | $340,000 | $354,988 | 96.0% |
| Nov 2025 | $356,200 | 24 | 69 | 160 | 6.7 | 50 | $372,150 | $375,536 | 97.0% |
| Dec 2025 | $348,400 | 19 | 48 | 131 | 6.9 | 42 | $367,500 | $365,132 | 95.0% |
| Jan 2026 | $344,000 | 25 | 68 | 127 | 5.1 | 58 | $347,000 | $356,773 | 97.0% |
| Feb 2026 | $342,700 | 20 | 79 | 161 | 8.1 | 48 | $417,393 | $408,303 | 97.0% |
| Mar 2026 | $344,600 | 29 | 89 | 183 | 6.3 | 41 | $375,000 | $381,662 | 97.0% |
| Apr 2026 | $349,000 | 33 | 82 | 182 | 5.5 | 43 | $335,000 | $366,295 | 97.0% |
| May 2026 | $347,400 | 43 | 81 | 186 | 4.3 | 62 | $332,000 | $356,946 | 97.0% |
| Jun 2026 | $345,500 | 38 | 85 | 184 | 4.8 | 52 | $330,250 | $342,892 | 96.0% |
| Jul 2026 | $334,400 | 32 | 70 | 179 | 5.6 | 40 | $327,000 | $334,379 | 96.0% |
| Aug 2026 | $331,100 | 36 | 60 | 153 | 4.3 | 59 | $328,250 | $340,400 | 96.0% |
| Sep 2026 | $326,100 | 24 | 59 | 144 | 6.0 | 62 | $357,500 | $353,199 | 96.0% |
September 2026 · apartment condos
In September 2026, the benchmark price for Northeast Calgary was $249,500, down 13.1% from September last year. 8 homes sold (down 58%), 43 new listings came on the market (down 39%), and there were 123 active listings at month end (down 27%). Among homes that sold, the median sale price was $234,250 (down 11.3%) and the average sale price was $233,500 (down 11.2%), and homes sold for 95.0% of their asking price. That is 15.4 months of supply, and homes spent 59 days on the market (down 2 days). Figures cover apartment condos.
View the numbers
| Measure | September 2026 | September last year |
|---|---|---|
| Benchmark price | $249,500 | $287,000 |
| Median price | $234,250 | $264,000 |
| Average price | $233,500 | $262,912 |
| Sold vs asking | 95.0% | 96.0% |
| Homes sold | 8 | 19 |
| New listings | 43 | 71 |
| Active listings | 123 | 168 |
| Months of supply | 15.4 | 8.8 |
| Days on market | 59 | 61 |
12-month trend
View the monthly numbers
| Month | Benchmark price | Sold | New listings | Active listings | Months of supply | Days on market | Median price | Average price | Sold vs asking |
|---|---|---|---|---|---|---|---|---|---|
| Oct 2025 | $279,300 | 23 | 61 | 163 | 7.1 | 71 | $255,000 | $252,337 | 95.0% |
| Nov 2025 | $273,400 | 23 | 41 | 142 | 6.2 | 72 | $270,000 | $269,952 | 96.0% |
| Dec 2025 | $269,900 | 15 | 26 | 101 | 6.7 | 67 | $233,000 | $232,333 | 95.0% |
| Jan 2026 | $266,800 | 9 | 68 | 117 | 13.0 | 90 | $250,000 | $243,667 | 94.0% |
| Feb 2026 | $260,600 | 12 | 50 | 132 | 11.0 | 61 | $248,750 | $248,667 | 95.0% |
| Mar 2026 | $264,400 | 16 | 53 | 137 | 8.6 | 58 | $235,750 | $237,131 | 95.0% |
| Apr 2026 | $261,500 | 19 | 61 | 139 | 7.3 | 45 | $253,000 | $247,489 | 95.0% |
| May 2026 | $260,000 | 17 | 49 | 135 | 7.9 | 58 | $240,000 | $240,965 | 96.0% |
| Jun 2026 | $254,600 | 21 | 58 | 132 | 6.3 | 58 | $235,000 | $245,067 | 95.0% |
| Jul 2026 | $253,400 | 20 | 46 | 131 | 6.6 | 49 | $246,500 | $241,275 | 94.0% |
| Aug 2026 | $251,900 | 13 | 46 | 126 | 9.7 | 52 | $235,700 | $250,919 | 94.0% |
| Sep 2026 | $249,500 | 8 | 43 | 123 | 15.4 | 59 | $234,250 | $233,500 | 95.0% |
Source: Calgary Real Estate Board (CREB®) monthly statistics. Benchmark price is the typical price of a home in the area. Median and average prices are for homes that sold in the month. Figures can be revised.
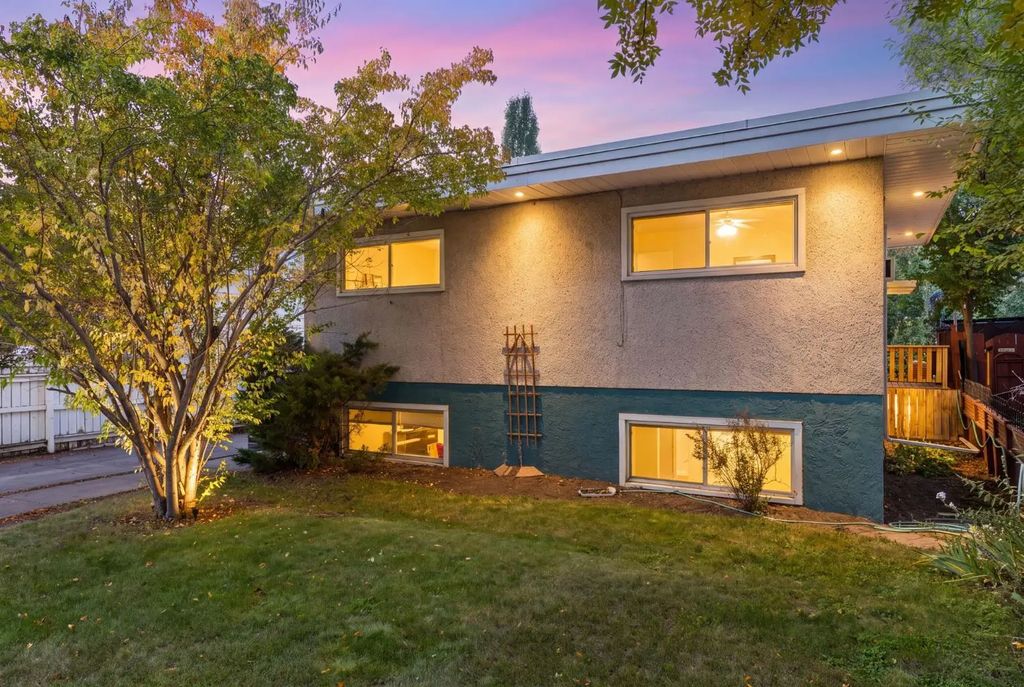
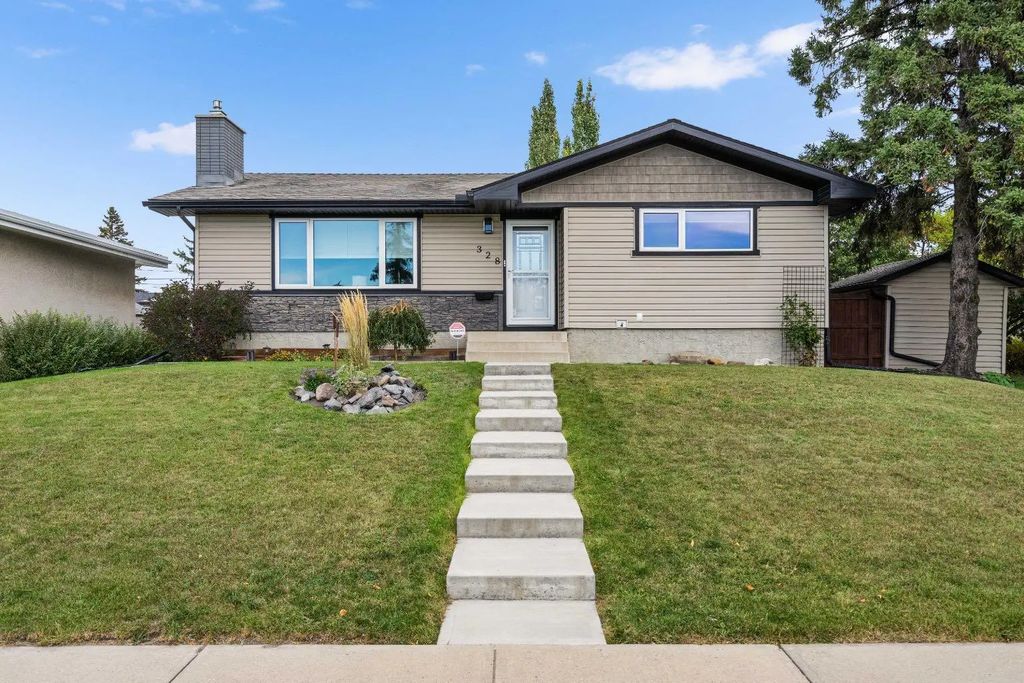
Mayland Heights is a mature, centrally located northeast Calgary community established in 1962 on land originally known as Crossroads. Bordered by the Trans-Canada Highway, Barlow Trail, Memorial Drive, and Deerfoot Trail, the neighbourhood sits just minutes from downtown Calgary, with Memorial Drive and Deerfoot Trail offering quick commuter routes. Mayland Heights has long been home to a sizeable Italian community and keeps a close-knit, established feel, supported by the Crossroads Community Association. Families have Mayland Heights Elementary School right in the neighbourhood for younger children. Housing here reflects its 1960s roots, with mature trees and established homes throughout. For buyers who want a well-located, inner-city-adjacent NE community with quick downtown access, Mayland Heights is a strong option.

Sign Up For A Free Calgary Real Estate Market Report!
Be a smart homeowner. Whether you are looking to buy or looking to sell, knowing your market makes a difference in your pocket. By signing up, you will receive a customized report, every month. This report gives you a 12-month summary with exclusive insights into Calgary real estate and your neighbourhood of choice.
The power of this report gives you special insights into information like average and median prices. Get to know what has sold and at what price in your neighborhood, and see where they are on Google Maps!
Get Your Free Market Report- All Listings
- $200,000 - $300,000
- $300,000 - $400,000
- $400,000 - $500,000
- $500,000 - $600,000
- $600,000 - $700,000
- $700,000 - $800,000


Frequently Asked Questions About Mayland Heights
How far is Mayland Heights from downtown Calgary?
Mayland Heights is a centrally located NE community bordered by Memorial Drive and Deerfoot Trail, both of which provide a quick, direct route into downtown Calgary. Its established, 1960s-era streets sit closer to the core than many newer NE communities.
What is the community character of Mayland Heights?
Mayland Heights is a mature neighbourhood, established in 1962, with a long-standing Italian community and a close-knit feel supported by the Crossroads Community Association. It's a good fit for buyers who want an established, inner-city-adjacent community over a newer suburban one.
Are there schools in Mayland Heights?
Yes, Mayland Heights Elementary School serves the community directly, giving families a nearby option for younger children. The community is not on the CTrain line, so residents connect to transit via Calgary Transit bus routes.