
Falconridge NE Calgary MLS® Listings
Houses, Condos and Real Estate For Sale.
Falconridge Market Snapshot
September 2026 · all residential property types
In September 2026, the benchmark price for Falconridge was $383,300, down 7.6% from September last year. 4 homes sold (down 60%), 11 new listings came on the market (down 48%), and there were 46 active listings at month end (up 31%). Among homes that sold, the median sale price was $453,500 (down 11.8%) and the average sale price was $426,500 (down 10.6%), and homes sold for 97.0% of their asking price. That is 11.5 months of supply, and homes spent 45 days on the market (up 8 days). Figures cover all residential property types.
View the numbers
| Measure | September 2026 | September last year |
|---|---|---|
| Benchmark price | $383,300 | $415,000 |
| Median price | $453,500 | $514,000 |
| Average price | $426,500 | $476,900 |
| Sold vs asking | 97.0% | 97.0% |
| Homes sold | 4 | 10 |
| New listings | 11 | 21 |
| Active listings | 46 | 35 |
| Months of supply | 11.5 | 3.5 |
| Days on market | 45 | 37 |
12-month trend
View the monthly numbers
| Month | Benchmark price | Sold | New listings | Active listings | Months of supply | Days on market | Median price | Average price | Sold vs asking |
|---|---|---|---|---|---|---|---|---|---|
| Oct 2025 | $408,500 | 5 | 19 | 38 | 7.6 | 13 | $450,000 | $469,000 | 99.0% |
| Nov 2025 | $406,700 | 1 | 16 | 37 | 37.0 | 97 | $465,000 | $465,000 | 95.0% |
| Dec 2025 | $399,700 | 3 | 10 | 33 | 11.0 | 26 | $520,000 | $535,000 | 97.0% |
| Jan 2026 | $400,500 | 11 | 14 | 27 | 2.5 | 49 | $455,000 | $454,636 | 96.0% |
| Feb 2026 | $399,700 | 2 | 14 | 28 | 14.0 | 77 | $407,000 | $407,000 | 96.0% |
| Mar 2026 | $398,800 | 10 | 9 | 22 | 2.2 | 35 | $460,750 | $439,650 | 96.0% |
| Apr 2026 | $395,500 | 3 | 17 | 27 | 9.0 | 77 | $471,000 | $479,500 | 96.0% |
| May 2026 | $390,100 | 9 | 29 | 41 | 4.6 | 42 | $400,000 | $411,401 | 98.0% |
| Jun 2026 | $388,900 | 4 | 23 | 46 | 11.5 | 17 | $425,000 | $435,500 | 100.0% |
| Jul 2026 | $381,800 | 8 | 27 | 54 | 6.8 | 59 | $408,750 | $386,762 | 97.0% |
| Aug 2026 | $379,200 | 11 | 25 | 48 | 4.4 | 48 | $303,000 | $341,273 | 96.0% |
| Sep 2026 | $383,300 | 4 | 11 | 46 | 11.5 | 45 | $453,500 | $426,500 | 97.0% |
September 2026 · detached homes
In September 2026, the benchmark price for Falconridge was $448,900, down 6.8% from September last year. 3 homes sold (down 63%), 7 new listings came on the market (down 46%), and there were 32 active listings at month end (up 45%). Among homes that sold, the median sale price was $460,000 (down 12.0%) and the average sale price was $477,333 (down 5.9%), and homes sold for 97.0% of their asking price. That is 10.7 months of supply, and homes spent 52 days on the market (up 10 days). Figures cover detached homes.
View the numbers
| Measure | September 2026 | September last year |
|---|---|---|
| Benchmark price | $448,900 | $481,400 |
| Median price | $460,000 | $522,500 |
| Average price | $477,333 | $507,125 |
| Sold vs asking | 97.0% | 97.0% |
| Homes sold | 3 | 8 |
| New listings | 7 | 13 |
| Active listings | 32 | 22 |
| Months of supply | 10.7 | 2.8 |
| Days on market | 52 | 42 |
12-month trend
View the monthly numbers
| Month | Benchmark price | Sold | New listings | Active listings | Months of supply | Days on market | Median price | Average price | Sold vs asking |
|---|---|---|---|---|---|---|---|---|---|
| Oct 2025 | $479,300 | 4 | 11 | 25 | 6.3 | 15 | $462,500 | $496,250 | 99.0% |
| Nov 2025 | $475,500 | 1 | 14 | 25 | 25.0 | 97 | $465,000 | $465,000 | 95.0% |
| Dec 2025 | $468,500 | 3 | 7 | 23 | 7.7 | 26 | $520,000 | $535,000 | 97.0% |
| Jan 2026 | $470,200 | 10 | 12 | 19 | 1.9 | 50 | $457,500 | $472,900 | 96.0% |
| Feb 2026 | $466,100 | 1 | 10 | 20 | 20.0 | 21 | $424,000 | $424,000 | 96.0% |
| Mar 2026 | $464,900 | 7 | 8 | 17 | 2.4 | 31 | $525,000 | $493,786 | 97.0% |
| Apr 2026 | $456,500 | 3 | 13 | 20 | 6.7 | 77 | $471,000 | $479,500 | 96.0% |
| May 2026 | $446,000 | 7 | 21 | 31 | 4.4 | 34 | $440,000 | $437,944 | 97.0% |
| Jun 2026 | $450,000 | 4 | 15 | 32 | 8.0 | 17 | $425,000 | $435,500 | 100.0% |
| Jul 2026 | $441,800 | 6 | 18 | 34 | 5.7 | 56 | $421,750 | $418,183 | 98.0% |
| Aug 2026 | $440,400 | 4 | 19 | 33 | 8.3 | 31 | $465,000 | $468,375 | 98.0% |
| Sep 2026 | $448,900 | 3 | 7 | 32 | 10.7 | 52 | $460,000 | $477,333 | 97.0% |
Source: Calgary Real Estate Board (CREB®) monthly statistics. Benchmark price is the typical price of a home in the area. Median and average prices are for homes that sold in the month. Figures can be revised.
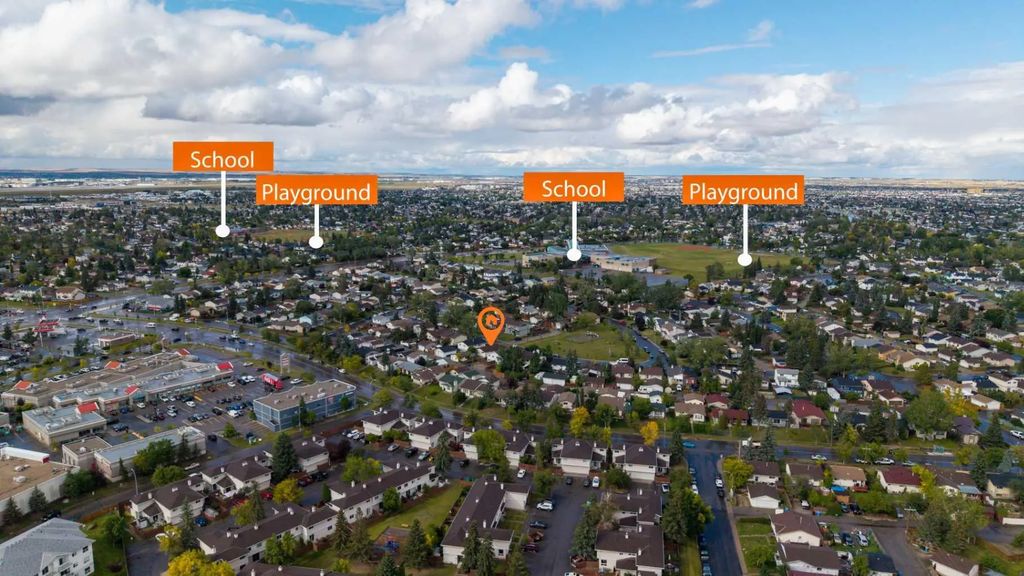
Established in 1979, Falconridge is one of northeast Calgary's long-standing family communities, bordered by Falconridge Boulevard, 64 Avenue, 68 Street and McKnight Boulevard. Families here have an unusually wide choice of schools close to home, from Falconridge and Grant MacEwan elementary schools in the public system to John XXIII and Bishop McNally High School in the Catholic system. Recreation is well covered too, with the Don Hartman Northeast Sportsplex and the nearby Village Square Leisure Centre, home to a wave pool and twin ice arenas, both just minutes away. The Falconridge/Castleridge Community Association, active since 1981, keeps a strong neighbourhood feel alive through year-round programming. With quick access to Deerfoot Trail and Stoney Trail and nearby C-Train service, Falconridge suits buyers looking for an established, budget-friendly NE community with real amenities close by.

Sign Up For A Free Calgary Real Estate Market Report!
Be a smart homeowner. Whether you are looking to buy or looking to sell, knowing your market makes a difference in your pocket. By signing up, you will receive a customized report, every month. This report gives you a 12-month summary with exclusive insights into Calgary real estate and your neighbourhood of choice.
The power of this report gives you special insights into information like average and median prices. Get to know what has sold and at what price in your neighborhood, and see where they are on Google Maps!
Get Your Free Market Report


Frequently Asked Questions About Falconridge
What schools serve Falconridge?
Falconridge has an unusually large selection of schools nearby, including Falconridge Elementary, Grant MacEwan Elementary, O.S. Geiger Elementary and Terry Fox Junior High in the public system, plus John XXIII Elementary/Junior High and Bishop McNally High School in the Catholic system. This makes it a practical choice for families with kids at multiple grade levels.
What recreation facilities are close to Falconridge?
Residents have access to the Don Hartman Northeast Sportsplex and the nearby Village Square Leisure Centre, which includes a wave pool and twin ice arenas. The Falconridge/Castleridge Community Association also runs regular family programming out of the community hall.
How is Falconridge for commuting?
Falconridge offers quick access to both Deerfoot Trail and Stoney Trail, making it easy to reach other parts of the city. The McKnight-Westwinds and Saddletowne C-Train stations are both a short drive away for residents who take transit downtown.