
Willowbrook Airdrie RMLS® Listings
Houses, Condos and Real Estate For Sale.
Airdrie Market Snapshot
Willowbrook had too few sales in September 2026 for community-level statistics, so this snapshot shows Airdrie, the city it belongs to.
September 2026 · all residential property types
In September 2026, the benchmark price for Airdrie was $505,800, down 3.8% from September last year. 115 homes sold (down 12%), 213 new listings came on the market (down 28%), and there were 481 active listings at month end (down 16%). Among homes that sold, the median sale price was $505,000 (down 4.7%) and the average sale price was $522,989 (down 4.0%), and homes sold for 97.0% of their asking price. That is 4.2 months of supply, and homes spent 52 days on the market (up 8 days). Figures cover all residential property types.
View the numbers
| Measure | September 2026 | September last year |
|---|---|---|
| Benchmark price | $505,800 | $525,600 |
| Median price | $505,000 | $530,000 |
| Average price | $522,989 | $544,639 |
| Sold vs asking | 97.0% | 98.0% |
| Homes sold | 115 | 131 |
| New listings | 213 | 295 |
| Active listings | 481 | 573 |
| Months of supply | 4.2 | 4.4 |
| Days on market | 52 | 44 |
12-month trend
View the monthly numbers
| Month | Benchmark price | Sold | New listings | Active listings | Months of supply | Days on market | Median price | Average price | Sold vs asking |
|---|---|---|---|---|---|---|---|---|---|
| Oct 2025 | $523,100 | 136 | 250 | 535 | 3.9 | 56 | $532,500 | $529,837 | 98.0% |
| Nov 2025 | $517,300 | 108 | 142 | 454 | 4.2 | 52 | $537,500 | $558,778 | 97.0% |
| Dec 2025 | $511,200 | 85 | 79 | 305 | 3.6 | 61 | $539,000 | $543,033 | 98.0% |
| Jan 2026 | $513,900 | 105 | 227 | 346 | 3.3 | 54 | $535,000 | $560,632 | 98.0% |
| Feb 2026 | $512,200 | 122 | 236 | 400 | 3.3 | 45 | $513,700 | $526,387 | 98.0% |
| Mar 2026 | $512,800 | 134 | 251 | 449 | 3.4 | 40 | $521,500 | $521,352 | 98.0% |
| Apr 2026 | $516,700 | 150 | 299 | 494 | 3.3 | 41 | $528,500 | $543,815 | 98.0% |
| May 2026 | $515,000 | 164 | 307 | 520 | 3.2 | 40 | $510,000 | $538,753 | 98.0% |
| Jun 2026 | $516,900 | 130 | 276 | 537 | 4.1 | 42 | $507,500 | $544,823 | 98.0% |
| Jul 2026 | $513,300 | 141 | 252 | 535 | 3.8 | 48 | $505,000 | $523,401 | 98.0% |
| Aug 2026 | $508,800 | 137 | 235 | 517 | 3.8 | 45 | $487,500 | $493,390 | 98.0% |
| Sep 2026 | $505,800 | 115 | 213 | 481 | 4.2 | 52 | $505,000 | $522,989 | 97.0% |
September 2026 · detached homes
In September 2026, the benchmark price for Airdrie was $591,900, down 4.7% from September last year. 71 homes sold (down 7%), 137 new listings came on the market (down 17%), and there were 294 active listings at month end (down 13%). Among homes that sold, the median sale price was $600,000 (down 3.6%) and the average sale price was $615,885 (down 4.1%), and homes sold for 97.0% of their asking price. That is 4.1 months of supply, and homes spent 50 days on the market (up 3 days). Figures cover detached homes.
View the numbers
| Measure | September 2026 | September last year |
|---|---|---|
| Benchmark price | $591,900 | $620,900 |
| Median price | $600,000 | $622,500 |
| Average price | $615,885 | $642,283 |
| Sold vs asking | 97.0% | 98.0% |
| Homes sold | 71 | 76 |
| New listings | 137 | 165 |
| Active listings | 294 | 337 |
| Months of supply | 4.1 | 4.4 |
| Days on market | 50 | 47 |
12-month trend
View the monthly numbers
| Month | Benchmark price | Sold | New listings | Active listings | Months of supply | Days on market | Median price | Average price | Sold vs asking |
|---|---|---|---|---|---|---|---|---|---|
| Oct 2025 | $617,700 | 78 | 139 | 304 | 3.9 | 55 | $621,950 | $633,897 | 98.0% |
| Nov 2025 | $608,300 | 69 | 89 | 251 | 3.6 | 56 | $608,000 | $632,621 | 97.0% |
| Dec 2025 | $599,900 | 48 | 46 | 176 | 3.7 | 59 | $636,500 | $647,891 | 98.0% |
| Jan 2026 | $605,900 | 62 | 139 | 196 | 3.2 | 50 | $606,450 | $674,419 | 98.0% |
| Feb 2026 | $603,500 | 70 | 136 | 231 | 3.3 | 42 | $605,000 | $618,916 | 99.0% |
| Mar 2026 | $605,400 | 73 | 154 | 264 | 3.6 | 36 | $610,000 | $631,218 | 98.0% |
| Apr 2026 | $610,700 | 92 | 185 | 287 | 3.1 | 42 | $612,250 | $644,367 | 98.0% |
| May 2026 | $605,600 | 99 | 190 | 302 | 3.1 | 40 | $590,000 | $634,646 | 98.0% |
| Jun 2026 | $608,400 | 76 | 167 | 318 | 4.2 | 36 | $622,500 | $651,733 | 98.0% |
| Jul 2026 | $603,100 | 85 | 146 | 307 | 3.6 | 44 | $599,000 | $621,623 | 98.0% |
| Aug 2026 | $596,200 | 74 | 144 | 313 | 4.2 | 44 | $588,219 | $582,908 | 98.0% |
| Sep 2026 | $591,900 | 71 | 137 | 294 | 4.1 | 50 | $600,000 | $615,885 | 97.0% |
September 2026 · semi-detached homes
In September 2026, the benchmark price for Airdrie was $470,400, down 4.9% from September last year. 13 homes sold (unchanged), 19 new listings came on the market (down 30%), and there were 39 active listings at month end (down 17%). Among homes that sold, the median sale price was $467,500 (down 10.7%) and the average sale price was $460,538 (down 9.4%), and homes sold for 98.0% of their asking price. That is 3.0 months of supply, and homes spent 49 days on the market (up 24 days). Figures cover semi-detached homes.
View the numbers
| Measure | September 2026 | September last year |
|---|---|---|
| Benchmark price | $470,400 | $494,600 |
| Median price | $467,500 | $523,600 |
| Average price | $460,538 | $508,277 |
| Sold vs asking | 98.0% | 99.0% |
| Homes sold | 13 | 13 |
| New listings | 19 | 27 |
| Active listings | 39 | 47 |
| Months of supply | 3.0 | 3.6 |
| Days on market | 49 | 25 |
12-month trend
View the monthly numbers
| Month | Benchmark price | Sold | New listings | Active listings | Months of supply | Days on market | Median price | Average price | Sold vs asking |
|---|---|---|---|---|---|---|---|---|---|
| Oct 2025 | $492,000 | 7 | 26 | 52 | 7.4 | 105 | $540,000 | $547,343 | 99.0% |
| Nov 2025 | $485,900 | 14 | 12 | 41 | 2.9 | 41 | $505,000 | $490,950 | 97.0% |
| Dec 2025 | $475,900 | 5 | 12 | 35 | 7.0 | 64 | $480,000 | $482,100 | 98.0% |
| Jan 2026 | $478,900 | 8 | 16 | 36 | 4.5 | 56 | $515,000 | $505,438 | 98.0% |
| Feb 2026 | $479,000 | 9 | 20 | 38 | 4.2 | 46 | $507,000 | $490,917 | 97.0% |
| Mar 2026 | $478,800 | 10 | 25 | 48 | 4.8 | 44 | $517,750 | $518,090 | 98.0% |
| Apr 2026 | $483,700 | 12 | 26 | 49 | 4.1 | 34 | $497,450 | $489,158 | 98.0% |
| May 2026 | $480,600 | 13 | 33 | 58 | 4.5 | 27 | $470,000 | $479,385 | 98.0% |
| Jun 2026 | $481,100 | 11 | 35 | 73 | 6.6 | 47 | $491,500 | $485,818 | 98.0% |
| Jul 2026 | $476,700 | 19 | 21 | 60 | 3.2 | 59 | $487,500 | $470,995 | 98.0% |
| Aug 2026 | $473,400 | 18 | 18 | 42 | 2.3 | 58 | $476,500 | $463,722 | 98.0% |
| Sep 2026 | $470,400 | 13 | 19 | 39 | 3.0 | 49 | $467,500 | $460,538 | 98.0% |
September 2026 · row and townhouse homes
In September 2026, the benchmark price for Airdrie was $360,900, down 5.6% from September last year. 22 homes sold (down 31%), 41 new listings came on the market (down 48%), and there were 113 active listings at month end (down 22%). Among homes that sold, the median sale price was $387,150 (down 8.9%) and the average sale price was $380,336 (down 8.2%), and homes sold for 98.0% of their asking price. That is 5.1 months of supply, and homes spent 57 days on the market (up 19 days). Figures cover row and townhouse homes.
View the numbers
| Measure | September 2026 | September last year |
|---|---|---|
| Benchmark price | $360,900 | $382,500 |
| Median price | $387,150 | $425,000 |
| Average price | $380,336 | $414,506 |
| Sold vs asking | 98.0% | 99.0% |
| Homes sold | 22 | 32 |
| New listings | 41 | 79 |
| Active listings | 113 | 145 |
| Months of supply | 5.1 | 4.5 |
| Days on market | 57 | 38 |
12-month trend
View the monthly numbers
| Month | Benchmark price | Sold | New listings | Active listings | Months of supply | Days on market | Median price | Average price | Sold vs asking |
|---|---|---|---|---|---|---|---|---|---|
| Oct 2025 | $380,500 | 41 | 67 | 133 | 3.2 | 52 | $391,000 | $396,716 | 97.0% |
| Nov 2025 | $379,600 | 21 | 29 | 117 | 5.6 | 42 | $420,000 | $417,613 | 97.0% |
| Dec 2025 | $375,000 | 27 | 15 | 67 | 2.5 | 62 | $415,000 | $418,761 | 97.0% |
| Jan 2026 | $364,900 | 28 | 51 | 78 | 2.8 | 65 | $418,500 | $406,729 | 97.0% |
| Feb 2026 | $364,300 | 36 | 65 | 93 | 2.6 | 51 | $401,500 | $402,860 | 98.0% |
| Mar 2026 | $361,200 | 36 | 51 | 97 | 2.7 | 41 | $400,000 | $403,089 | 98.0% |
| Apr 2026 | $358,900 | 31 | 65 | 116 | 3.7 | 44 | $401,500 | $399,852 | 98.0% |
| May 2026 | $367,000 | 38 | 61 | 116 | 3.1 | 37 | $429,700 | $411,315 | 99.0% |
| Jun 2026 | $365,200 | 35 | 56 | 105 | 3.0 | 49 | $410,000 | $393,857 | 98.0% |
| Jul 2026 | $366,200 | 22 | 63 | 126 | 5.7 | 52 | $385,000 | $383,307 | 98.0% |
| Aug 2026 | $361,400 | 31 | 57 | 123 | 4.0 | 43 | $407,000 | $396,394 | 98.0% |
| Sep 2026 | $360,900 | 22 | 41 | 113 | 5.1 | 57 | $387,150 | $380,336 | 98.0% |
September 2026 · apartment condos
In September 2026, the benchmark price for Airdrie was $259,900, down 10.4% from September last year. 9 homes sold (down 10%), 16 new listings came on the market (down 33%), and there were 35 active listings at month end (down 20%). Among homes that sold, the median sale price was $225,000 (down 17.4%) and the average sale price was $229,056 (down 14.0%), and homes sold for 97.0% of their asking price. That is 3.9 months of supply, and homes spent 62 days on the market (down 3 days). Figures cover apartment condos.
View the numbers
| Measure | September 2026 | September last year |
|---|---|---|
| Benchmark price | $259,900 | $290,200 |
| Median price | $225,000 | $272,500 |
| Average price | $229,056 | $266,250 |
| Sold vs asking | 97.0% | 96.0% |
| Homes sold | 9 | 10 |
| New listings | 16 | 24 |
| Active listings | 35 | 44 |
| Months of supply | 3.9 | 4.4 |
| Days on market | 62 | 65 |
12-month trend
View the monthly numbers
| Month | Benchmark price | Sold | New listings | Active listings | Months of supply | Days on market | Median price | Average price | Sold vs asking |
|---|---|---|---|---|---|---|---|---|---|
| Oct 2025 | $284,000 | 10 | 18 | 46 | 4.6 | 47 | $242,500 | $251,700 | 97.0% |
| Nov 2025 | $278,200 | 4 | 12 | 45 | 11.3 | 69 | $227,000 | $263,500 | 98.0% |
| Dec 2025 | $278,900 | 5 | 6 | 27 | 5.4 | 72 | $280,000 | $268,400 | 97.0% |
| Jan 2026 | $276,400 | 7 | 21 | 36 | 5.1 | 46 | $223,000 | $231,500 | 96.0% |
| Feb 2026 | $272,100 | 7 | 15 | 38 | 5.4 | 57 | $285,000 | $281,986 | 97.0% |
| Mar 2026 | $266,800 | 15 | 21 | 40 | 2.7 | 58 | $268,000 | $272,680 | 98.0% |
| Apr 2026 | $268,000 | 15 | 23 | 42 | 2.8 | 38 | $229,800 | $268,340 | 98.0% |
| May 2026 | $266,500 | 14 | 23 | 44 | 3.1 | 52 | $265,250 | $261,679 | 98.0% |
| Jun 2026 | $265,700 | 8 | 18 | 41 | 5.1 | 55 | $258,000 | $270,780 | 96.0% |
| Jul 2026 | $258,400 | 15 | 22 | 42 | 2.8 | 50 | $227,000 | $238,660 | 97.0% |
| Aug 2026 | $261,000 | 14 | 16 | 39 | 2.8 | 41 | $248,000 | $273,143 | 96.0% |
| Sep 2026 | $259,900 | 9 | 16 | 35 | 3.9 | 62 | $225,000 | $229,056 | 97.0% |
Source: Calgary Real Estate Board (CREB®) monthly statistics. Benchmark price is the typical price of a home in the area. Median and average prices are for homes that sold in the month. Figures can be revised.
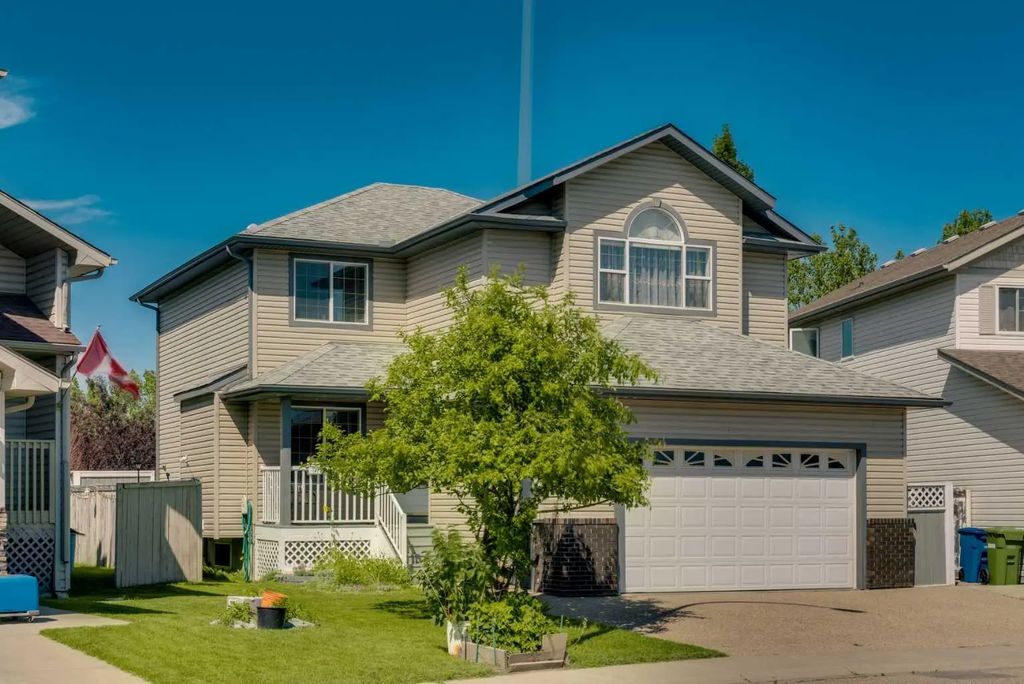
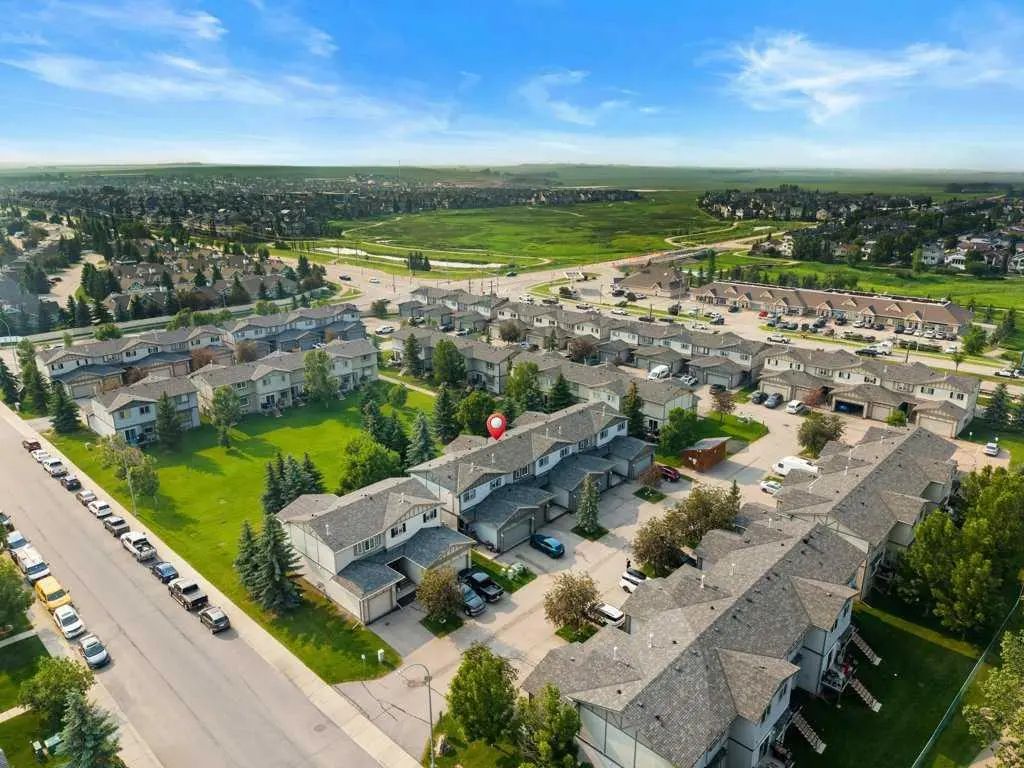
Willowbrook is an established residential community in northwest Airdrie, identifiable on real estate listings by its Willowbrook Drive and Willowbrook Crescent NW addresses. The neighbourhood is built around Willow Brook Pond and connects to Nose Creek and the Williamstown Nose Creek Preserve via a network of walking paths, with many homes oriented toward west-facing backyards along these green corridors. Housing is varied, including detached single-family homes, row and townhouses, and apartment condos, with unit sizes ranging from roughly 900 to over 2,200 square feet. Families in Willowbrook are part of the area's Tri-Schools zone, served by Ecole Edwards Elementary, Ecole Airdrie Middle, and George McDougall High School, plus Calgary Catholic School District options.
Willowbrook Airdrie Real Estate Listings - Homes, Condos and Townhouses For Sale


Featured Neighbourhoods in Airdrie
- Airdrie Meadows
- Bayside
- Baysprings
- Bayview
- Big Springs
- Buffalo Rub
- Canals
- Chinook Gate
- Cobblestone
- Coopers Crossing
- Edgewater
- Fairways
- Fletcher Village
- Jensen
- Kings Heights
- Lanark
- Luxstone
- Meadowbrook
- Midtown
- Morningside
- Old Town
- Prairie Springs
- Ravenswood
- Reunion
- Ridgegate
- Sagewood
- Silver Creek
- South Point
- South Windsong
- Stonegate
- Summerhill
- Sunridge
- The Village
- Thorburn
- Waterstone
- Williamstown
- Willowbrook
- Windsong
- Woodside
- Yankee Valley Estates
Frequently Asked Questions About Willowbrook
What water features are in Willowbrook?
Willow Brook Pond sits within the community, and a connected pathway system links it to Nose Creek and the neighbouring Williamstown Nose Creek Preserve for walking and cycling.
What types of homes are in Willowbrook?
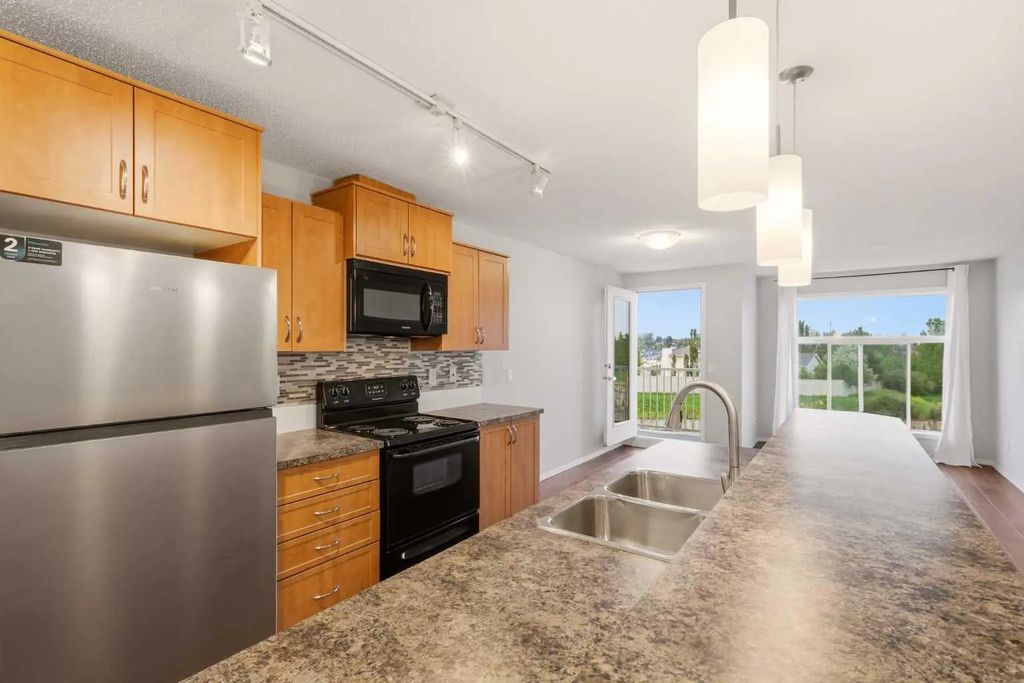
A mix of detached single-family homes, row and townhouses, and apartment condos, generally ranging from about 900 to over 2,200 square feet.
What schools serve Willowbrook?
The community falls within the Tri-Schools zone, served by Ecole Edwards Elementary, Ecole Airdrie Middle, and George McDougall High School, along with Calgary Catholic School District options.