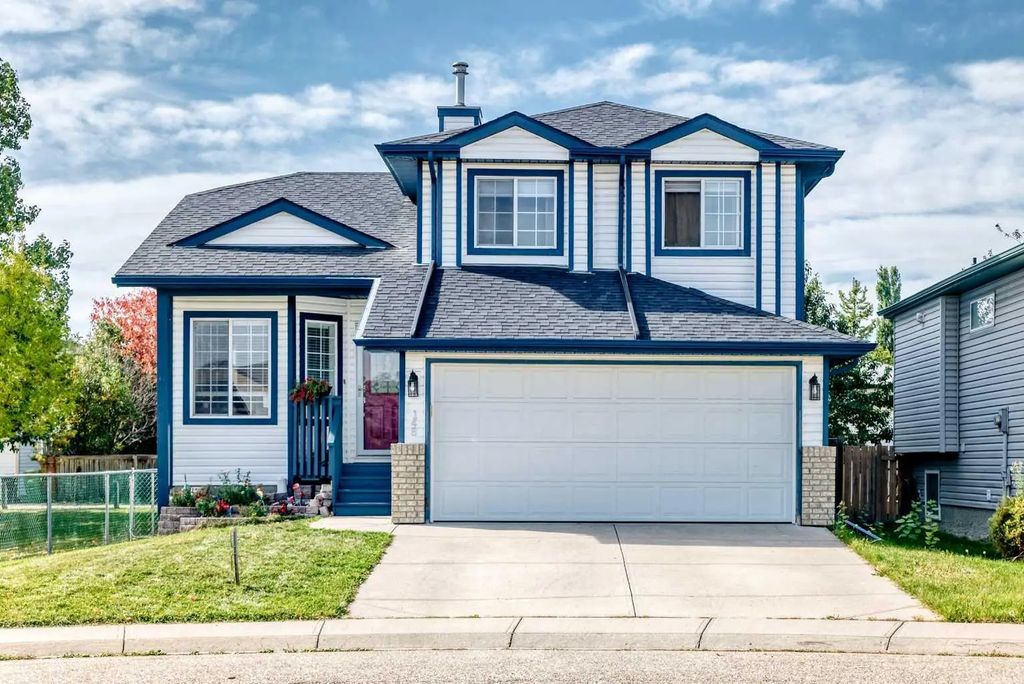
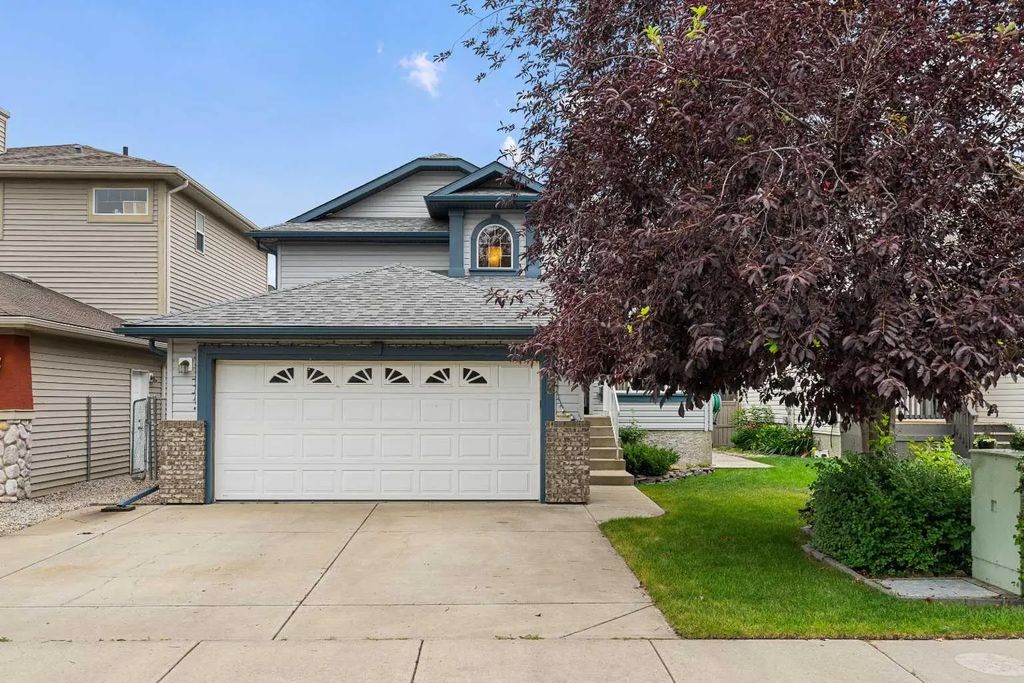
Silver Creek had too few sales in September 2026 for community-level statistics, so this snapshot shows Airdrie, the city it belongs to.
September 2026 · all residential property types
Benchmark price
$505,800
▼ 3.8% vs September
Median price
$505,000
▼ 4.7% vs September
Average price
$522,989
▼ 4.0% vs September
Sold vs asking
97.0%
▼ 1.0 pts vs September
Homes sold
115
▼ 12% vs September
New listings
213
▼ 28% vs September
Active listings
481
▼ 16% vs September
Months of supply
4.2
▼ 0.2 vs September
Days on market
52
▲ 8 days vs September
September 2026September last year
In September 2026, the benchmark price for Airdrie was $505,800, down 3.8% from September last year. 115 homes sold (down 12%), 213 new listings came on the market (down 28%), and there were 481 active listings at month end (down 16%). Among homes that sold, the median sale price was $505,000 (down 4.7%) and the average sale price was $522,989 (down 4.0%), and homes sold for 97.0% of their asking price. That is 4.2 months of supply, and homes spent 52 days on the market (up 8 days). Figures cover all residential property types.
View the numbers
Measure
September 2026
September last year
Benchmark price
$505,800
$525,600
Median price
$505,000
$530,000
Average price
$522,989
$544,639
Sold vs asking
97.0%
98.0%
Homes sold
115
131
New listings
213
295
Active listings
481
573
Months of supply
4.2
4.4
Days on market
52
44
12-month trend
Benchmark price
$505,800
Oct 2025Sep 2026
Down 3.3% since Oct 2025
Median price
$505,000
Oct 2025Sep 2026
Down 5.2% since Oct 2025
Homes sold
115
Oct 2025Sep 2026
Range 85 to 164
Active listings
481
Oct 2025Sep 2026
Range 305 to 537
Months of supply
4.2
Oct 2025Sep 2026
Range 3.2 to 4.2
Sold vs asking
97.0%
Oct 2025Sep 2026
Range 97.0% to 98.0%
Last 12 monthsSame months a year earlier (dashed)
View the monthly numbers
Month
Benchmark price
Sold
New listings
Active listings
Months of supply
Days on market
Median price
Average price
Sold vs asking
Oct 2025
$523,100
136
250
535
3.9
56
$532,500
$529,837
98.0%
Nov 2025
$517,300
108
142
454
4.2
52
$537,500
$558,778
97.0%
Dec 2025
$511,200
85
79
305
3.6
61
$539,000
$543,033
98.0%
Jan 2026
$513,900
105
227
346
3.3
54
$535,000
$560,632
98.0%
Feb 2026
$512,200
122
236
400
3.3
45
$513,700
$526,387
98.0%
Mar 2026
$512,800
134
251
449
3.4
40
$521,500
$521,352
98.0%
Apr 2026
$516,700
150
299
494
3.3
41
$528,500
$543,815
98.0%
May 2026
$515,000
164
307
520
3.2
40
$510,000
$538,753
98.0%
Jun 2026
$516,900
130
276
537
4.1
42
$507,500
$544,823
98.0%
Jul 2026
$513,300
141
252
535
3.8
48
$505,000
$523,401
98.0%
Aug 2026
$508,800
137
235
517
3.8
45
$487,500
$493,390
98.0%
Sep 2026
$505,800
115
213
481
4.2
52
$505,000
$522,989
97.0%
September 2026 · detached homes
Benchmark price
$591,900
▼ 4.7% vs September
Median price
$600,000
▼ 3.6% vs September
Average price
$615,885
▼ 4.1% vs September
Sold vs asking
97.0%
▼ 1.0 pts vs September
Homes sold
71
▼ 7% vs September
New listings
137
▼ 17% vs September
Active listings
294
▼ 13% vs September
Months of supply
4.1
▼ 0.3 vs September
Days on market
50
▲ 3 days vs September
September 2026September last year
In September 2026, the benchmark price for Airdrie was $591,900, down 4.7% from September last year. 71 homes sold (down 7%), 137 new listings came on the market (down 17%), and there were 294 active listings at month end (down 13%). Among homes that sold, the median sale price was $600,000 (down 3.6%) and the average sale price was $615,885 (down 4.1%), and homes sold for 97.0% of their asking price. That is 4.1 months of supply, and homes spent 50 days on the market (up 3 days). Figures cover detached homes.
View the numbers
Measure
September 2026
September last year
Benchmark price
$591,900
$620,900
Median price
$600,000
$622,500
Average price
$615,885
$642,283
Sold vs asking
97.0%
98.0%
Homes sold
71
76
New listings
137
165
Active listings
294
337
Months of supply
4.1
4.4
Days on market
50
47
12-month trend
Benchmark price
$591,900
Oct 2025Sep 2026
Down 4.2% since Oct 2025
Median price
$600,000
Oct 2025Sep 2026
Down 3.5% since Oct 2025
Homes sold
71
Oct 2025Sep 2026
Range 48 to 99
Active listings
294
Oct 2025Sep 2026
Range 176 to 318
Months of supply
4.1
Oct 2025Sep 2026
Range 3.1 to 4.2
Sold vs asking
97.0%
Oct 2025Sep 2026
Range 97.0% to 99.0%
Last 12 monthsSame months a year earlier (dashed)
View the monthly numbers
Month
Benchmark price
Sold
New listings
Active listings
Months of supply
Days on market
Median price
Average price
Sold vs asking
Oct 2025
$617,700
78
139
304
3.9
55
$621,950
$633,897
98.0%
Nov 2025
$608,300
69
89
251
3.6
56
$608,000
$632,621
97.0%
Dec 2025
$599,900
48
46
176
3.7
59
$636,500
$647,891
98.0%
Jan 2026
$605,900
62
139
196
3.2
50
$606,450
$674,419
98.0%
Feb 2026
$603,500
70
136
231
3.3
42
$605,000
$618,916
99.0%
Mar 2026
$605,400
73
154
264
3.6
36
$610,000
$631,218
98.0%
Apr 2026
$610,700
92
185
287
3.1
42
$612,250
$644,367
98.0%
May 2026
$605,600
99
190
302
3.1
40
$590,000
$634,646
98.0%
Jun 2026
$608,400
76
167
318
4.2
36
$622,500
$651,733
98.0%
Jul 2026
$603,100
85
146
307
3.6
44
$599,000
$621,623
98.0%
Aug 2026
$596,200
74
144
313
4.2
44
$588,219
$582,908
98.0%
Sep 2026
$591,900
71
137
294
4.1
50
$600,000
$615,885
97.0%
September 2026 · semi-detached homes
Benchmark price
$470,400
▼ 4.9% vs September
Median price
$467,500
▼ 10.7% vs September
Average price
$460,538
▼ 9.4% vs September
Sold vs asking
98.0%
▼ 1.0 pts vs September
Homes sold
13
▬ No change vs September
New listings
19
▼ 30% vs September
Active listings
39
▼ 17% vs September
Months of supply
3.0
▼ 0.6 vs September
Days on market
49
▲ 24 days vs September
September 2026September last year
In September 2026, the benchmark price for Airdrie was $470,400, down 4.9% from September last year. 13 homes sold (unchanged), 19 new listings came on the market (down 30%), and there were 39 active listings at month end (down 17%). Among homes that sold, the median sale price was $467,500 (down 10.7%) and the average sale price was $460,538 (down 9.4%), and homes sold for 98.0% of their asking price. That is 3.0 months of supply, and homes spent 49 days on the market (up 24 days). Figures cover semi-detached homes.
View the numbers
Measure
September 2026
September last year
Benchmark price
$470,400
$494,600
Median price
$467,500
$523,600
Average price
$460,538
$508,277
Sold vs asking
98.0%
99.0%
Homes sold
13
13
New listings
19
27
Active listings
39
47
Months of supply
3.0
3.6
Days on market
49
25
12-month trend
Benchmark price
$470,400
Oct 2025Sep 2026
Down 4.4% since Oct 2025
Median price
$467,500
Oct 2025Sep 2026
Down 13.4% since Oct 2025
Homes sold
13
Oct 2025Sep 2026
Range 5 to 19
Active listings
39
Oct 2025Sep 2026
Range 35 to 73
Months of supply
3.0
Oct 2025Sep 2026
Range 2.3 to 7.4
Sold vs asking
98.0%
Oct 2025Sep 2026
Range 97.0% to 99.0%
Last 12 monthsSame months a year earlier (dashed)
View the monthly numbers
Month
Benchmark price
Sold
New listings
Active listings
Months of supply
Days on market
Median price
Average price
Sold vs asking
Oct 2025
$492,000
7
26
52
7.4
105
$540,000
$547,343
99.0%
Nov 2025
$485,900
14
12
41
2.9
41
$505,000
$490,950
97.0%
Dec 2025
$475,900
5
12
35
7.0
64
$480,000
$482,100
98.0%
Jan 2026
$478,900
8
16
36
4.5
56
$515,000
$505,438
98.0%
Feb 2026
$479,000
9
20
38
4.2
46
$507,000
$490,917
97.0%
Mar 2026
$478,800
10
25
48
4.8
44
$517,750
$518,090
98.0%
Apr 2026
$483,700
12
26
49
4.1
34
$497,450
$489,158
98.0%
May 2026
$480,600
13
33
58
4.5
27
$470,000
$479,385
98.0%
Jun 2026
$481,100
11
35
73
6.6
47
$491,500
$485,818
98.0%
Jul 2026
$476,700
19
21
60
3.2
59
$487,500
$470,995
98.0%
Aug 2026
$473,400
18
18
42
2.3
58
$476,500
$463,722
98.0%
Sep 2026
$470,400
13
19
39
3.0
49
$467,500
$460,538
98.0%
September 2026 · row and townhouse homes
Benchmark price
$360,900
▼ 5.6% vs September
Median price
$387,150
▼ 8.9% vs September
Average price
$380,336
▼ 8.2% vs September
Sold vs asking
98.0%
▼ 1.0 pts vs September
Homes sold
22
▼ 31% vs September
New listings
41
▼ 48% vs September
Active listings
113
▼ 22% vs September
Months of supply
5.1
▲ 0.6 vs September
Days on market
57
▲ 19 days vs September
September 2026September last year
In September 2026, the benchmark price for Airdrie was $360,900, down 5.6% from September last year. 22 homes sold (down 31%), 41 new listings came on the market (down 48%), and there were 113 active listings at month end (down 22%). Among homes that sold, the median sale price was $387,150 (down 8.9%) and the average sale price was $380,336 (down 8.2%), and homes sold for 98.0% of their asking price. That is 5.1 months of supply, and homes spent 57 days on the market (up 19 days). Figures cover row and townhouse homes.
View the numbers
Measure
September 2026
September last year
Benchmark price
$360,900
$382,500
Median price
$387,150
$425,000
Average price
$380,336
$414,506
Sold vs asking
98.0%
99.0%
Homes sold
22
32
New listings
41
79
Active listings
113
145
Months of supply
5.1
4.5
Days on market
57
38
12-month trend
Benchmark price
$360,900
Oct 2025Sep 2026
Down 5.2% since Oct 2025
Median price
$387,150
Oct 2025Sep 2026
Down 1.0% since Oct 2025
Homes sold
22
Oct 2025Sep 2026
Range 21 to 41
Active listings
113
Oct 2025Sep 2026
Range 67 to 133
Months of supply
5.1
Oct 2025Sep 2026
Range 2.5 to 5.7
Sold vs asking
98.0%
Oct 2025Sep 2026
Range 97.0% to 99.0%
Last 12 monthsSame months a year earlier (dashed)
View the monthly numbers
Month
Benchmark price
Sold
New listings
Active listings
Months of supply
Days on market
Median price
Average price
Sold vs asking
Oct 2025
$380,500
41
67
133
3.2
52
$391,000
$396,716
97.0%
Nov 2025
$379,600
21
29
117
5.6
42
$420,000
$417,613
97.0%
Dec 2025
$375,000
27
15
67
2.5
62
$415,000
$418,761
97.0%
Jan 2026
$364,900
28
51
78
2.8
65
$418,500
$406,729
97.0%
Feb 2026
$364,300
36
65
93
2.6
51
$401,500
$402,860
98.0%
Mar 2026
$361,200
36
51
97
2.7
41
$400,000
$403,089
98.0%
Apr 2026
$358,900
31
65
116
3.7
44
$401,500
$399,852
98.0%
May 2026
$367,000
38
61
116
3.1
37
$429,700
$411,315
99.0%
Jun 2026
$365,200
35
56
105
3.0
49
$410,000
$393,857
98.0%
Jul 2026
$366,200
22
63
126
5.7
52
$385,000
$383,307
98.0%
Aug 2026
$361,400
31
57
123
4.0
43
$407,000
$396,394
98.0%
Sep 2026
$360,900
22
41
113
5.1
57
$387,150
$380,336
98.0%
September 2026 · apartment condos
Benchmark price
$259,900
▼ 10.4% vs September
Median price
$225,000
▼ 17.4% vs September
Average price
$229,056
▼ 14.0% vs September
Sold vs asking
97.0%
▲ 1.0 pts vs September
Homes sold
9
▼ 10% vs September
New listings
16
▼ 33% vs September
Active listings
35
▼ 20% vs September
Months of supply
3.9
▼ 0.5 vs September
Days on market
62
▼ 3 days vs September
September 2026September last year
In September 2026, the benchmark price for Airdrie was $259,900, down 10.4% from September last year. 9 homes sold (down 10%), 16 new listings came on the market (down 33%), and there were 35 active listings at month end (down 20%). Among homes that sold, the median sale price was $225,000 (down 17.4%) and the average sale price was $229,056 (down 14.0%), and homes sold for 97.0% of their asking price. That is 3.9 months of supply, and homes spent 62 days on the market (down 3 days). Figures cover apartment condos.
View the numbers
Measure
September 2026
September last year
Benchmark price
$259,900
$290,200
Median price
$225,000
$272,500
Average price
$229,056
$266,250
Sold vs asking
97.0%
96.0%
Homes sold
9
10
New listings
16
24
Active listings
35
44
Months of supply
3.9
4.4
Days on market
62
65
12-month trend
Benchmark price
$259,900
Oct 2025Sep 2026
Down 8.5% since Oct 2025
Median price
$225,000
Oct 2025Sep 2026
Down 7.2% since Oct 2025
Homes sold
9
Oct 2025Sep 2026
Range 4 to 15
Active listings
35
Oct 2025Sep 2026
Range 27 to 46
Months of supply
3.9
Oct 2025Sep 2026
Range 2.7 to 11.3
Sold vs asking
97.0%
Oct 2025Sep 2026
Range 96.0% to 98.0%
Last 12 monthsSame months a year earlier (dashed)
View the monthly numbers
Month
Benchmark price
Sold
New listings
Active listings
Months of supply
Days on market
Median price
Average price
Sold vs asking
Oct 2025
$284,000
10
18
46
4.6
47
$242,500
$251,700
97.0%
Nov 2025
$278,200
4
12
45
11.3
69
$227,000
$263,500
98.0%
Dec 2025
$278,900
5
6
27
5.4
72
$280,000
$268,400
97.0%
Jan 2026
$276,400
7
21
36
5.1
46
$223,000
$231,500
96.0%
Feb 2026
$272,100
7
15
38
5.4
57
$285,000
$281,986
97.0%
Mar 2026
$266,800
15
21
40
2.7
58
$268,000
$272,680
98.0%
Apr 2026
$268,000
15
23
42
2.8
38
$229,800
$268,340
98.0%
May 2026
$266,500
14
23
44
3.1
52
$265,250
$261,679
98.0%
Jun 2026
$265,700
8
18
41
5.1
55
$258,000
$270,780
96.0%
Jul 2026
$258,400
15
22
42
2.8
50
$227,000
$238,660
97.0%
Aug 2026
$261,000
14
16
39
2.8
41
$248,000
$273,143
96.0%
Sep 2026
$259,900
9
16
35
3.9
62
$225,000
$229,056
97.0%
Source: Calgary Real Estate Board (CREB®) monthly statistics. Benchmark price is the typical price of a home in the area. Median and average prices are for homes that sold in the month. Figures can be revised.
Silver Creek sits along Airdrie's far northern edge, north of Veterans Boulevard and east of Highway 2, bordering the Nose Creek River and the Williamstown Nose Creek Preserve trail system. Housing is a mix of single-family detached homes and townhomes, with townhomes generally the more affordable entry point and detached homes moving up from there. Major retailers including Costco, CrossIron Mills, Real Canadian Superstore, and Canadian Tire are all a short drive away, alongside Woodside Golf Course and Creek Springs Road Playground. Families are served by Herons Crossing School (kindergarten to grade 8) in neighbouring Williamstown, Ralph McCall Elementary, C.W. Perry Middle School, and Airdrie Christian Academy, across Rocky View and Calgary Catholic school divisions.
Silver Creek Airdrie MLS® Listings - Homes, Condos and Townhouses For Sale
Sign Up For A Free Airdrie Real Estate Market Report!
Be a smart homeowner. Whether you are looking to buy or looking to sell, knowing your market makes a difference in your pocket.
By signing up, you will receive a customized report, every month. This report gives you a 12-month summary with exclusive insights into Airdrie real estate and your neighbourhood of choice.
The power of this report gives you special insights into information like average and median prices. Get to know what has sold and at what price in your neighborhood, and see where they are on Google Maps!
Along Airdrie's far northern edge, north of Veterans Boulevard and east of Highway 2, bordering the Nose Creek River and the Williamstown Nose Creek Preserve trail system.
What home types does Silver Creek offer?
A mix of single-family detached homes and townhomes, with townhomes typically the more affordable option and detached homes positioned higher in the price range.
What amenities and schools are nearby?
Costco, CrossIron Mills, Real Canadian Superstore, and Canadian Tire are all close by, along with Woodside Golf Course; Herons Crossing School, Ralph McCall Elementary, and C.W. Perry Middle School serve the area.