
Cobblestone Airdrie MLS® Listings
Cobblestone Creek is a new neighbourhood in Airdrie by Melcor Developments.
Airdrie Market Snapshot
Cobblestone had too few sales in September 2026 for community-level statistics, so this snapshot shows Airdrie, the city it belongs to.
September 2026 · all residential property types
In September 2026, the benchmark price for Airdrie was $505,800, down 3.8% from September last year. 115 homes sold (down 12%), 213 new listings came on the market (down 28%), and there were 481 active listings at month end (down 16%). Among homes that sold, the median sale price was $505,000 (down 4.7%) and the average sale price was $522,989 (down 4.0%), and homes sold for 97.0% of their asking price. That is 4.2 months of supply, and homes spent 52 days on the market (up 8 days). Figures cover all residential property types.
View the numbers
| Measure | September 2026 | September last year |
|---|---|---|
| Benchmark price | $505,800 | $525,600 |
| Median price | $505,000 | $530,000 |
| Average price | $522,989 | $544,639 |
| Sold vs asking | 97.0% | 98.0% |
| Homes sold | 115 | 131 |
| New listings | 213 | 295 |
| Active listings | 481 | 573 |
| Months of supply | 4.2 | 4.4 |
| Days on market | 52 | 44 |
12-month trend
View the monthly numbers
| Month | Benchmark price | Sold | New listings | Active listings | Months of supply | Days on market | Median price | Average price | Sold vs asking |
|---|---|---|---|---|---|---|---|---|---|
| Oct 2025 | $523,100 | 136 | 250 | 535 | 3.9 | 56 | $532,500 | $529,837 | 98.0% |
| Nov 2025 | $517,300 | 108 | 142 | 454 | 4.2 | 52 | $537,500 | $558,778 | 97.0% |
| Dec 2025 | $511,200 | 85 | 79 | 305 | 3.6 | 61 | $539,000 | $543,033 | 98.0% |
| Jan 2026 | $513,900 | 105 | 227 | 346 | 3.3 | 54 | $535,000 | $560,632 | 98.0% |
| Feb 2026 | $512,200 | 122 | 236 | 400 | 3.3 | 45 | $513,700 | $526,387 | 98.0% |
| Mar 2026 | $512,800 | 134 | 251 | 449 | 3.4 | 40 | $521,500 | $521,352 | 98.0% |
| Apr 2026 | $516,700 | 150 | 299 | 494 | 3.3 | 41 | $528,500 | $543,815 | 98.0% |
| May 2026 | $515,000 | 164 | 307 | 520 | 3.2 | 40 | $510,000 | $538,753 | 98.0% |
| Jun 2026 | $516,900 | 130 | 276 | 537 | 4.1 | 42 | $507,500 | $544,823 | 98.0% |
| Jul 2026 | $513,300 | 141 | 252 | 535 | 3.8 | 48 | $505,000 | $523,401 | 98.0% |
| Aug 2026 | $508,800 | 137 | 235 | 517 | 3.8 | 45 | $487,500 | $493,390 | 98.0% |
| Sep 2026 | $505,800 | 115 | 213 | 481 | 4.2 | 52 | $505,000 | $522,989 | 97.0% |
September 2026 · detached homes
In September 2026, the benchmark price for Airdrie was $591,900, down 4.7% from September last year. 71 homes sold (down 7%), 137 new listings came on the market (down 17%), and there were 294 active listings at month end (down 13%). Among homes that sold, the median sale price was $600,000 (down 3.6%) and the average sale price was $615,885 (down 4.1%), and homes sold for 97.0% of their asking price. That is 4.1 months of supply, and homes spent 50 days on the market (up 3 days). Figures cover detached homes.
View the numbers
| Measure | September 2026 | September last year |
|---|---|---|
| Benchmark price | $591,900 | $620,900 |
| Median price | $600,000 | $622,500 |
| Average price | $615,885 | $642,283 |
| Sold vs asking | 97.0% | 98.0% |
| Homes sold | 71 | 76 |
| New listings | 137 | 165 |
| Active listings | 294 | 337 |
| Months of supply | 4.1 | 4.4 |
| Days on market | 50 | 47 |
12-month trend
View the monthly numbers
| Month | Benchmark price | Sold | New listings | Active listings | Months of supply | Days on market | Median price | Average price | Sold vs asking |
|---|---|---|---|---|---|---|---|---|---|
| Oct 2025 | $617,700 | 78 | 139 | 304 | 3.9 | 55 | $621,950 | $633,897 | 98.0% |
| Nov 2025 | $608,300 | 69 | 89 | 251 | 3.6 | 56 | $608,000 | $632,621 | 97.0% |
| Dec 2025 | $599,900 | 48 | 46 | 176 | 3.7 | 59 | $636,500 | $647,891 | 98.0% |
| Jan 2026 | $605,900 | 62 | 139 | 196 | 3.2 | 50 | $606,450 | $674,419 | 98.0% |
| Feb 2026 | $603,500 | 70 | 136 | 231 | 3.3 | 42 | $605,000 | $618,916 | 99.0% |
| Mar 2026 | $605,400 | 73 | 154 | 264 | 3.6 | 36 | $610,000 | $631,218 | 98.0% |
| Apr 2026 | $610,700 | 92 | 185 | 287 | 3.1 | 42 | $612,250 | $644,367 | 98.0% |
| May 2026 | $605,600 | 99 | 190 | 302 | 3.1 | 40 | $590,000 | $634,646 | 98.0% |
| Jun 2026 | $608,400 | 76 | 167 | 318 | 4.2 | 36 | $622,500 | $651,733 | 98.0% |
| Jul 2026 | $603,100 | 85 | 146 | 307 | 3.6 | 44 | $599,000 | $621,623 | 98.0% |
| Aug 2026 | $596,200 | 74 | 144 | 313 | 4.2 | 44 | $588,219 | $582,908 | 98.0% |
| Sep 2026 | $591,900 | 71 | 137 | 294 | 4.1 | 50 | $600,000 | $615,885 | 97.0% |
September 2026 · semi-detached homes
In September 2026, the benchmark price for Airdrie was $470,400, down 4.9% from September last year. 13 homes sold (unchanged), 19 new listings came on the market (down 30%), and there were 39 active listings at month end (down 17%). Among homes that sold, the median sale price was $467,500 (down 10.7%) and the average sale price was $460,538 (down 9.4%), and homes sold for 98.0% of their asking price. That is 3.0 months of supply, and homes spent 49 days on the market (up 24 days). Figures cover semi-detached homes.
View the numbers
| Measure | September 2026 | September last year |
|---|---|---|
| Benchmark price | $470,400 | $494,600 |
| Median price | $467,500 | $523,600 |
| Average price | $460,538 | $508,277 |
| Sold vs asking | 98.0% | 99.0% |
| Homes sold | 13 | 13 |
| New listings | 19 | 27 |
| Active listings | 39 | 47 |
| Months of supply | 3.0 | 3.6 |
| Days on market | 49 | 25 |
12-month trend
View the monthly numbers
| Month | Benchmark price | Sold | New listings | Active listings | Months of supply | Days on market | Median price | Average price | Sold vs asking |
|---|---|---|---|---|---|---|---|---|---|
| Oct 2025 | $492,000 | 7 | 26 | 52 | 7.4 | 105 | $540,000 | $547,343 | 99.0% |
| Nov 2025 | $485,900 | 14 | 12 | 41 | 2.9 | 41 | $505,000 | $490,950 | 97.0% |
| Dec 2025 | $475,900 | 5 | 12 | 35 | 7.0 | 64 | $480,000 | $482,100 | 98.0% |
| Jan 2026 | $478,900 | 8 | 16 | 36 | 4.5 | 56 | $515,000 | $505,438 | 98.0% |
| Feb 2026 | $479,000 | 9 | 20 | 38 | 4.2 | 46 | $507,000 | $490,917 | 97.0% |
| Mar 2026 | $478,800 | 10 | 25 | 48 | 4.8 | 44 | $517,750 | $518,090 | 98.0% |
| Apr 2026 | $483,700 | 12 | 26 | 49 | 4.1 | 34 | $497,450 | $489,158 | 98.0% |
| May 2026 | $480,600 | 13 | 33 | 58 | 4.5 | 27 | $470,000 | $479,385 | 98.0% |
| Jun 2026 | $481,100 | 11 | 35 | 73 | 6.6 | 47 | $491,500 | $485,818 | 98.0% |
| Jul 2026 | $476,700 | 19 | 21 | 60 | 3.2 | 59 | $487,500 | $470,995 | 98.0% |
| Aug 2026 | $473,400 | 18 | 18 | 42 | 2.3 | 58 | $476,500 | $463,722 | 98.0% |
| Sep 2026 | $470,400 | 13 | 19 | 39 | 3.0 | 49 | $467,500 | $460,538 | 98.0% |
September 2026 · row and townhouse homes
In September 2026, the benchmark price for Airdrie was $360,900, down 5.6% from September last year. 22 homes sold (down 31%), 41 new listings came on the market (down 48%), and there were 113 active listings at month end (down 22%). Among homes that sold, the median sale price was $387,150 (down 8.9%) and the average sale price was $380,336 (down 8.2%), and homes sold for 98.0% of their asking price. That is 5.1 months of supply, and homes spent 57 days on the market (up 19 days). Figures cover row and townhouse homes.
View the numbers
| Measure | September 2026 | September last year |
|---|---|---|
| Benchmark price | $360,900 | $382,500 |
| Median price | $387,150 | $425,000 |
| Average price | $380,336 | $414,506 |
| Sold vs asking | 98.0% | 99.0% |
| Homes sold | 22 | 32 |
| New listings | 41 | 79 |
| Active listings | 113 | 145 |
| Months of supply | 5.1 | 4.5 |
| Days on market | 57 | 38 |
12-month trend
View the monthly numbers
| Month | Benchmark price | Sold | New listings | Active listings | Months of supply | Days on market | Median price | Average price | Sold vs asking |
|---|---|---|---|---|---|---|---|---|---|
| Oct 2025 | $380,500 | 41 | 67 | 133 | 3.2 | 52 | $391,000 | $396,716 | 97.0% |
| Nov 2025 | $379,600 | 21 | 29 | 117 | 5.6 | 42 | $420,000 | $417,613 | 97.0% |
| Dec 2025 | $375,000 | 27 | 15 | 67 | 2.5 | 62 | $415,000 | $418,761 | 97.0% |
| Jan 2026 | $364,900 | 28 | 51 | 78 | 2.8 | 65 | $418,500 | $406,729 | 97.0% |
| Feb 2026 | $364,300 | 36 | 65 | 93 | 2.6 | 51 | $401,500 | $402,860 | 98.0% |
| Mar 2026 | $361,200 | 36 | 51 | 97 | 2.7 | 41 | $400,000 | $403,089 | 98.0% |
| Apr 2026 | $358,900 | 31 | 65 | 116 | 3.7 | 44 | $401,500 | $399,852 | 98.0% |
| May 2026 | $367,000 | 38 | 61 | 116 | 3.1 | 37 | $429,700 | $411,315 | 99.0% |
| Jun 2026 | $365,200 | 35 | 56 | 105 | 3.0 | 49 | $410,000 | $393,857 | 98.0% |
| Jul 2026 | $366,200 | 22 | 63 | 126 | 5.7 | 52 | $385,000 | $383,307 | 98.0% |
| Aug 2026 | $361,400 | 31 | 57 | 123 | 4.0 | 43 | $407,000 | $396,394 | 98.0% |
| Sep 2026 | $360,900 | 22 | 41 | 113 | 5.1 | 57 | $387,150 | $380,336 | 98.0% |
September 2026 · apartment condos
In September 2026, the benchmark price for Airdrie was $259,900, down 10.4% from September last year. 9 homes sold (down 10%), 16 new listings came on the market (down 33%), and there were 35 active listings at month end (down 20%). Among homes that sold, the median sale price was $225,000 (down 17.4%) and the average sale price was $229,056 (down 14.0%), and homes sold for 97.0% of their asking price. That is 3.9 months of supply, and homes spent 62 days on the market (down 3 days). Figures cover apartment condos.
View the numbers
| Measure | September 2026 | September last year |
|---|---|---|
| Benchmark price | $259,900 | $290,200 |
| Median price | $225,000 | $272,500 |
| Average price | $229,056 | $266,250 |
| Sold vs asking | 97.0% | 96.0% |
| Homes sold | 9 | 10 |
| New listings | 16 | 24 |
| Active listings | 35 | 44 |
| Months of supply | 3.9 | 4.4 |
| Days on market | 62 | 65 |
12-month trend
View the monthly numbers
| Month | Benchmark price | Sold | New listings | Active listings | Months of supply | Days on market | Median price | Average price | Sold vs asking |
|---|---|---|---|---|---|---|---|---|---|
| Oct 2025 | $284,000 | 10 | 18 | 46 | 4.6 | 47 | $242,500 | $251,700 | 97.0% |
| Nov 2025 | $278,200 | 4 | 12 | 45 | 11.3 | 69 | $227,000 | $263,500 | 98.0% |
| Dec 2025 | $278,900 | 5 | 6 | 27 | 5.4 | 72 | $280,000 | $268,400 | 97.0% |
| Jan 2026 | $276,400 | 7 | 21 | 36 | 5.1 | 46 | $223,000 | $231,500 | 96.0% |
| Feb 2026 | $272,100 | 7 | 15 | 38 | 5.4 | 57 | $285,000 | $281,986 | 97.0% |
| Mar 2026 | $266,800 | 15 | 21 | 40 | 2.7 | 58 | $268,000 | $272,680 | 98.0% |
| Apr 2026 | $268,000 | 15 | 23 | 42 | 2.8 | 38 | $229,800 | $268,340 | 98.0% |
| May 2026 | $266,500 | 14 | 23 | 44 | 3.1 | 52 | $265,250 | $261,679 | 98.0% |
| Jun 2026 | $265,700 | 8 | 18 | 41 | 5.1 | 55 | $258,000 | $270,780 | 96.0% |
| Jul 2026 | $258,400 | 15 | 22 | 42 | 2.8 | 50 | $227,000 | $238,660 | 97.0% |
| Aug 2026 | $261,000 | 14 | 16 | 39 | 2.8 | 41 | $248,000 | $273,143 | 96.0% |
| Sep 2026 | $259,900 | 9 | 16 | 35 | 3.9 | 62 | $225,000 | $229,056 | 97.0% |
Source: Calgary Real Estate Board (CREB®) monthly statistics. Benchmark price is the typical price of a home in the area. Median and average prices are for homes that sold in the month. Figures can be revised.
Cobblestone Creek is a planned community that meets the City of Airdrie's AirdrieONE Sustainability Principles (Development Staging, Attention to the Details of Complete Streets, Focus on Public Spaces Designed for People, Provision of Recreational Amenities that Capture Natural Beauty, Preservation and Enhancement of Natural Amenities, Active Modes Placed Central to Design , Modified Grid Network, Mixture of Housing Types, Distinct Neighbourhoods, Programmable Open Spaces, Inclusion of Public Art, Preserving Natural Watercourses, Land Use Orientation for Efficient Public Transportation)
Cobblestone Creek, when completed, will consist of front driveway single family houses (about 317 homes), detached houses with rear lanes (214), semi-detached homes with front drive and/or lane access (431 homes) and about 246 townhouse properties.
Cobblestone Airdrie Real Estate Listings - Homes, Condos and Townhouses For Sale
No listings were found matching your search criteria.
Luxury Airdrie Real Estate Listings - Homes, Condos and Townhouses For Sale
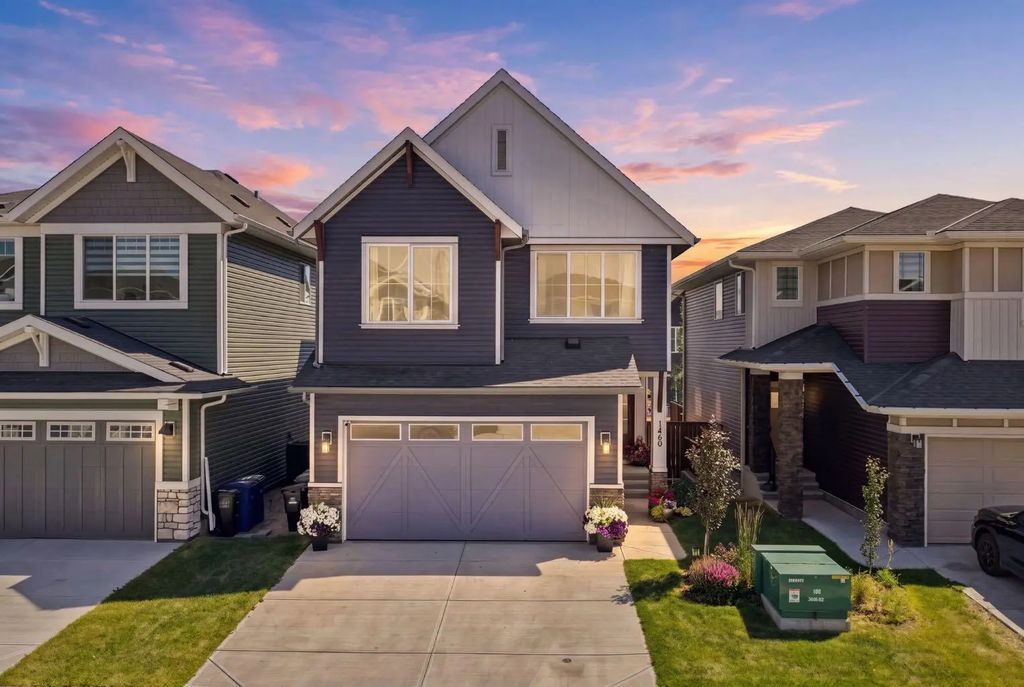
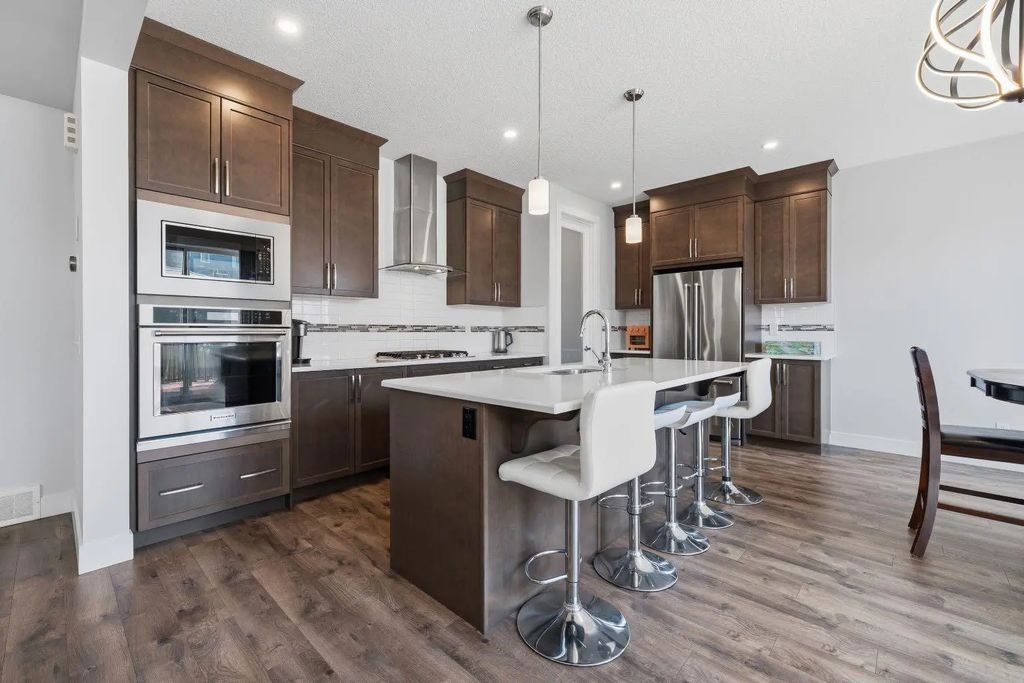
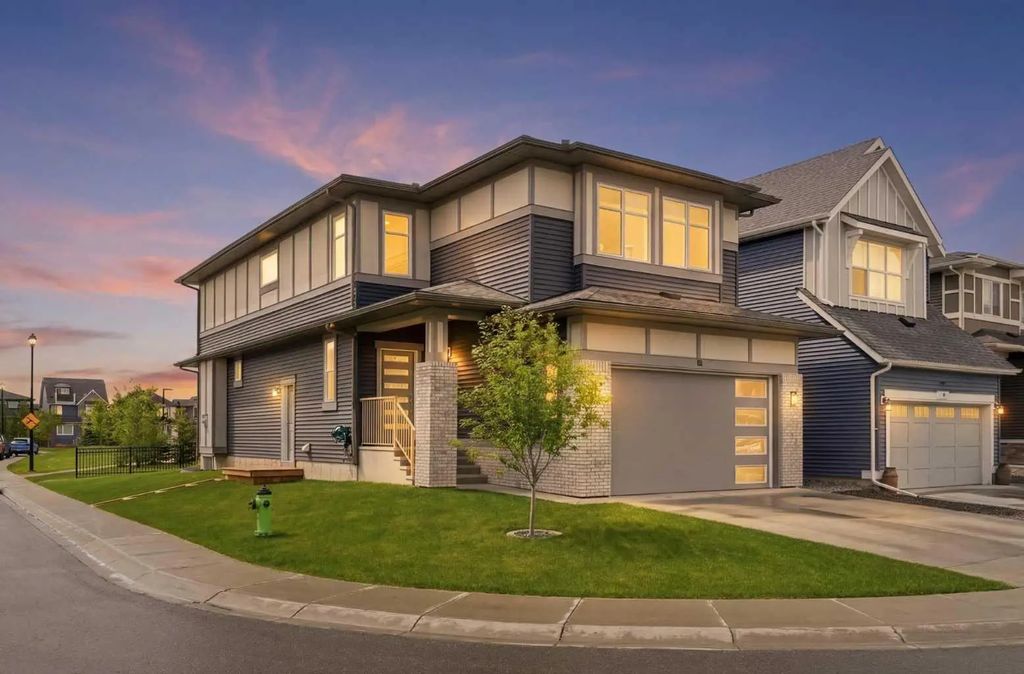
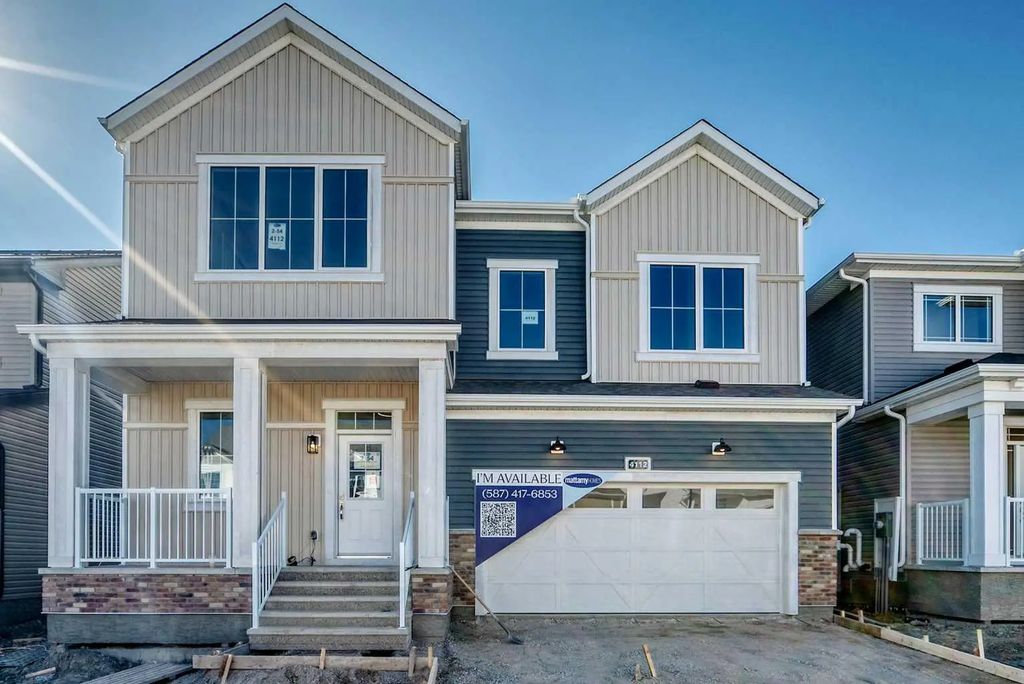
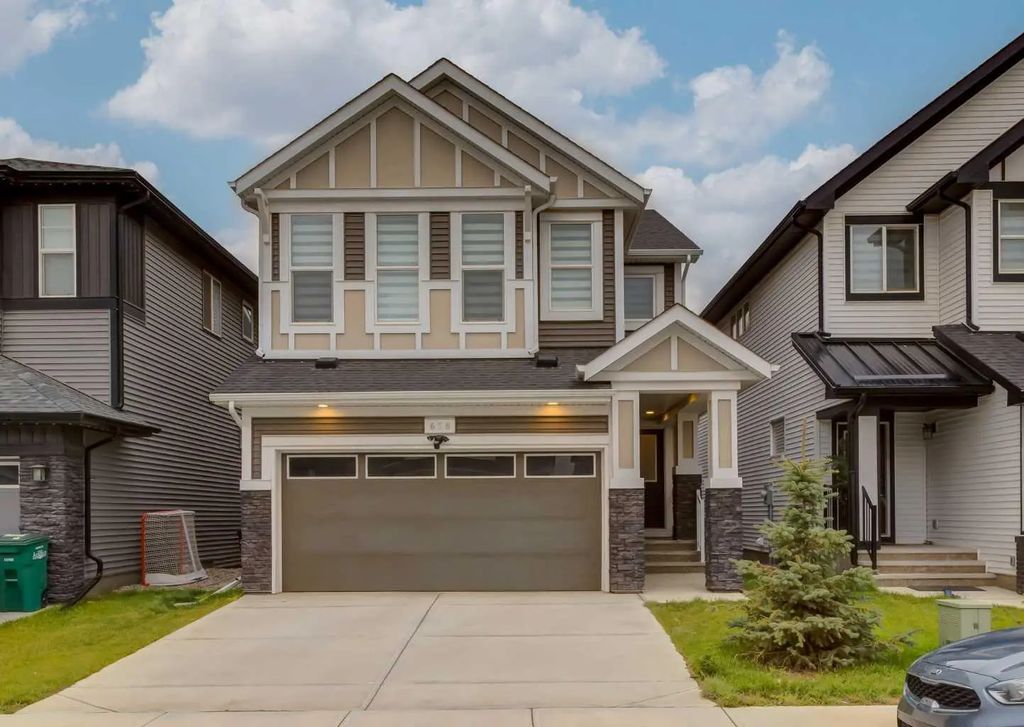
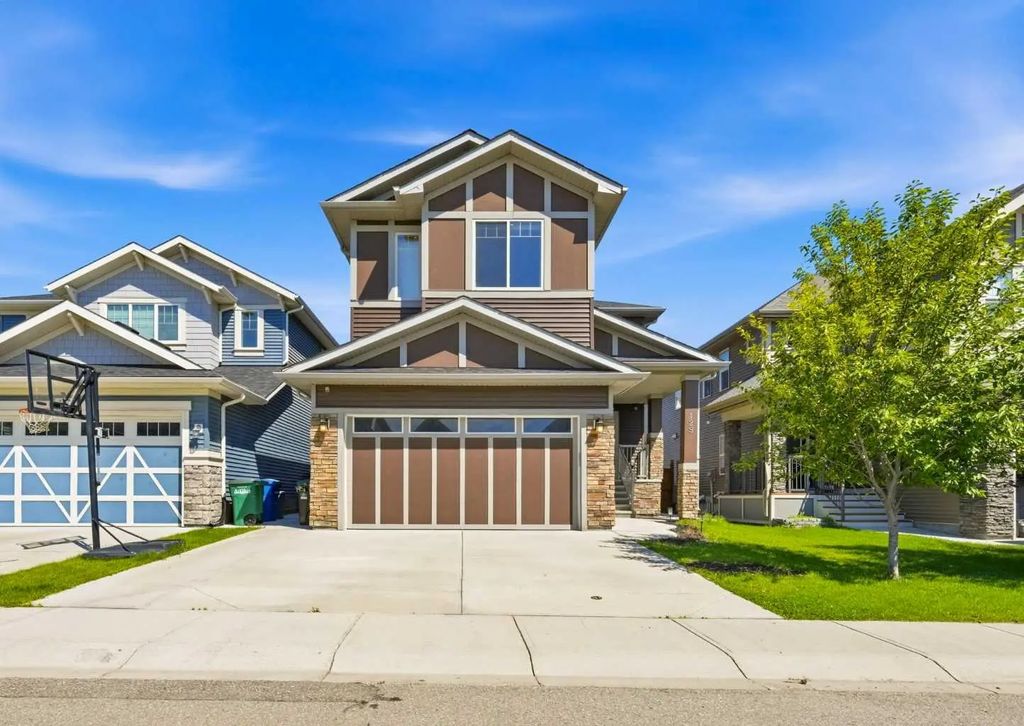
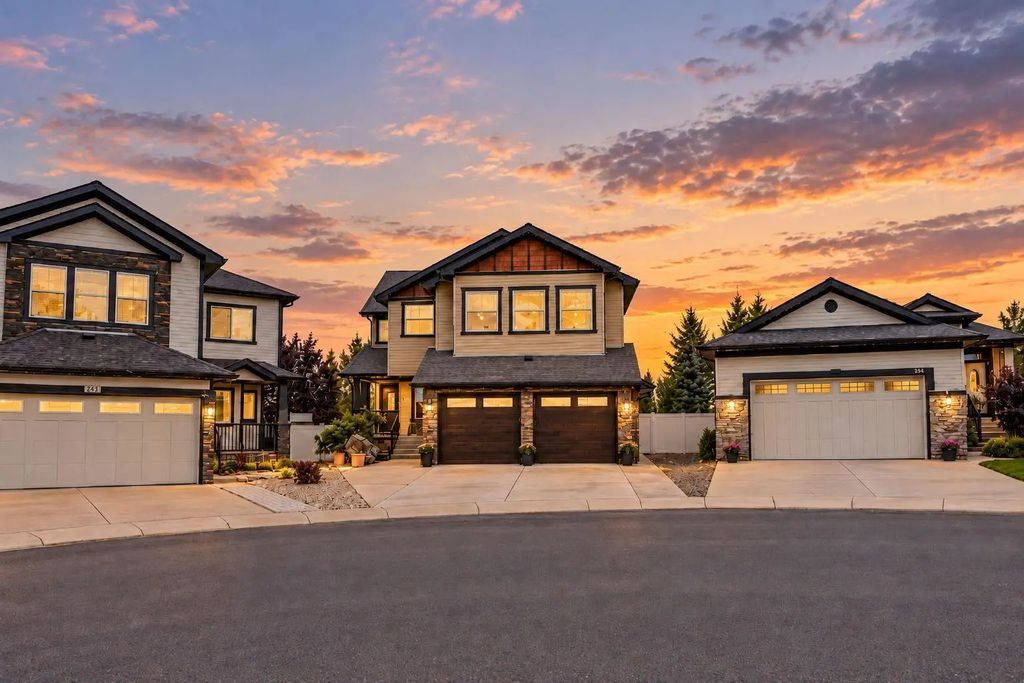
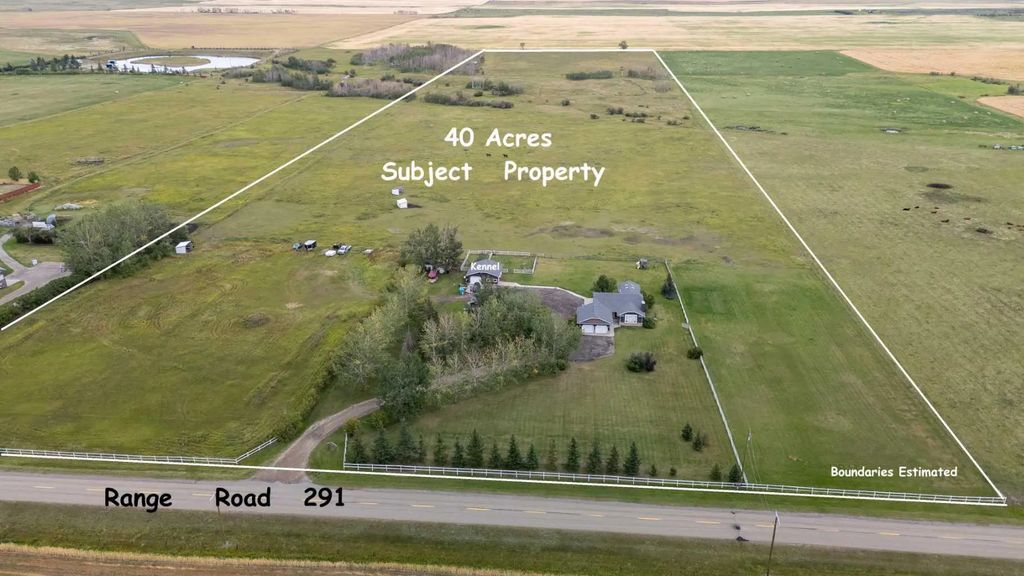
Featured Neighbourhoods in Airdrie
- Airdrie Meadows
- Bayside
- Baysprings
- Bayview
- Big Springs
- Buffalo Rub
- Canals
- Chinook Gate
- Cobblestone
- Coopers Crossing
- Edgewater
- Fairways
- Fletcher Village
- Jensen
- Kings Heights
- Lanark
- Luxstone
- Meadowbrook
- Midtown
- Morningside
- Old Town
- Prairie Springs
- Ravenswood
- Reunion
- Ridgegate
- Sagewood
- Silver Creek
- South Point
- South Windsong
- Stonegate
- Summerhill
- Sunridge
- The Village
- Thorburn
- Waterstone
- Williamstown
- Willowbrook
- Windsong
- Woodside
- Yankee Valley Estates
Frequently Asked Questions About Cobblestone Creek
Who is developing Cobblestone Creek and how big will it be?
Melcor Developments is building Cobblestone Creek, having acquired the land in the early 2000s and begun detailed planning in 2015; the finished community will include more than 1,200 homes from four builders.
What recreational amenities does Cobblestone Creek offer?
The community has its own tennis and pickleball courts, opened in 2023 and floodable for winter skating, plus basketball courts, connected parks, and direct access to Chinook Winds Regional Park next door.
What home styles are available in Cobblestone Creek?
Builders Douglas Homes, Excel Homes, Rohit Communities, and Shane Homes offer laned and front-drive single-family and semi-detached homes in Prairie Brownstone, Tudor, and Craftsman architectural styles.