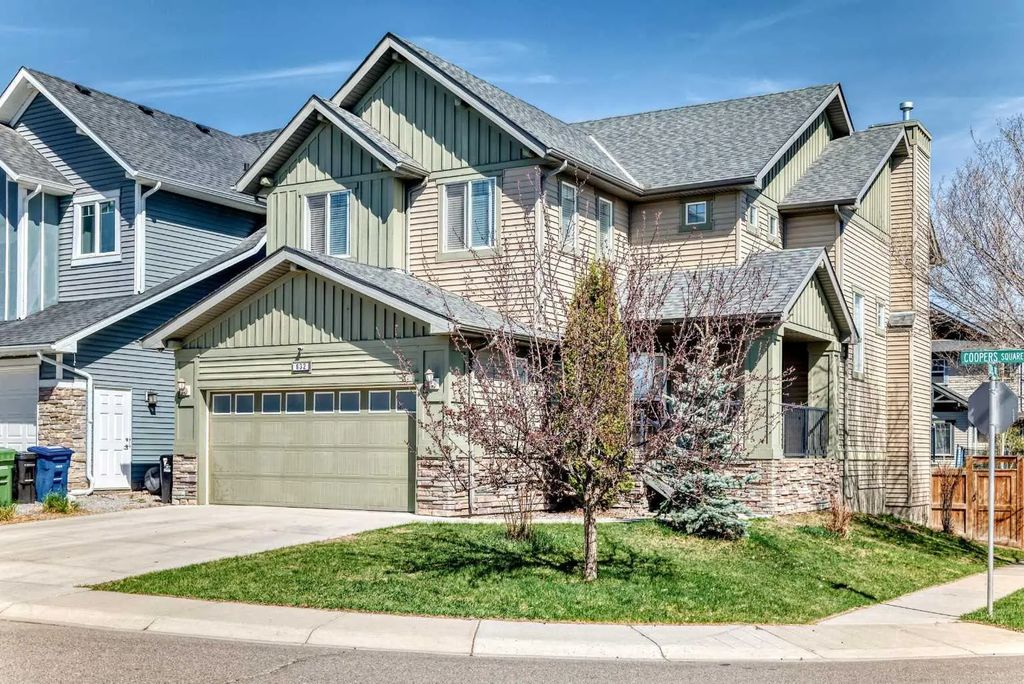
In September 2026, the benchmark price for Coopers Crossing was $682,900, down 6.7% from September last year. 9 homes sold (unchanged), 11 new listings came on the market (down 35%), and there were 24 active listings at month end (down 31%). Among homes that sold, the median sale price was $919,700 (up 22.6%) and the average sale price was $832,856 (up 6.9%), and homes sold for 97.0% of their asking price. That is 2.7 months of supply, and homes spent 49 days on the market (up 17 days). Figures cover all residential property types.
View the numbers
Measure
September 2026
September last year
Benchmark price
$682,900
$732,300
Median price
$919,700
$750,000
Average price
$832,856
$778,833
Sold vs asking
97.0%
99.0%
Homes sold
9
9
New listings
11
17
Active listings
24
35
Months of supply
2.7
3.9
Days on market
49
32
12-month trend
Benchmark price
$682,900
Oct 2025Sep 2026
Down 5.9% since Oct 2025
Median price
$919,700
Oct 2025Sep 2026
Up 73.2% since Oct 2025
Homes sold
9
Oct 2025Sep 2026
Range 2 to 18
Active listings
24
Oct 2025Sep 2026
Range 21 to 43
Months of supply
2.7
Oct 2025Sep 2026
Range 1.9 to 21.5
Sold vs asking
97.0%
Oct 2025Sep 2026
Range 96.0% to 100.0%
Last 12 monthsSame months a year earlier (dashed)
View the monthly numbers
Month
Benchmark price
Sold
New listings
Active listings
Months of supply
Days on market
Median price
Average price
Sold vs asking
Oct 2025
$726,100
2
21
43
21.5
79
$531,000
$531,000
100.0%
Nov 2025
$717,400
10
10
35
3.5
50
$768,500
$756,840
97.0%
Dec 2025
$705,800
6
4
21
3.5
52
$618,500
$606,000
98.0%
Jan 2026
$712,000
9
19
28
3.1
51
$935,000
$952,044
98.0%
Feb 2026
$705,600
5
11
28
5.6
56
$630,000
$775,000
98.0%
Mar 2026
$708,100
6
20
41
6.8
25
$657,500
$731,167
98.0%
Apr 2026
$712,700
8
18
42
5.3
48
$858,750
$861,156
99.0%
May 2026
$703,300
18
19
34
1.9
41
$741,250
$720,500
98.0%
Jun 2026
$705,300
5
22
36
7.2
44
$880,000
$875,000
96.0%
Jul 2026
$698,600
11
17
36
3.3
33
$752,500
$779,000
98.0%
Aug 2026
$692,900
5
11
32
6.4
50
$540,000
$560,300
98.0%
Sep 2026
$682,900
9
11
24
2.7
49
$919,700
$832,856
97.0%
September 2026 · detached homes
Benchmark price
$737,400
▼ 4.5% vs September
Median price
$1,032,500
▲ 36.8% vs September
Average price
$1,002,450
▲ 18.4% vs September
Sold vs asking
97.0%
▼ 1.0 pts vs September
Homes sold
6
▼ 14% vs September
New listings
10
▼ 23% vs September
Active listings
17
▼ 19% vs September
Months of supply
2.8
▼ 0.2 vs September
Days on market
40
▲ 4 days vs September
September 2026September last year
In September 2026, the benchmark price for Coopers Crossing was $737,400, down 4.5% from September last year. 6 homes sold (down 14%), 10 new listings came on the market (down 23%), and there were 17 active listings at month end (down 19%). Among homes that sold, the median sale price was $1,032,500 (up 36.8%) and the average sale price was $1,002,450 (up 18.4%), and homes sold for 97.0% of their asking price. That is 2.8 months of supply, and homes spent 40 days on the market (up 4 days). Figures cover detached homes.
View the numbers
Measure
September 2026
September last year
Benchmark price
$737,400
$771,900
Median price
$1,032,500
$755,000
Average price
$1,002,450
$846,643
Sold vs asking
97.0%
98.0%
Homes sold
6
7
New listings
10
13
Active listings
17
21
Months of supply
2.8
3.0
Days on market
40
36
12-month trend
Benchmark price
$737,400
Oct 2025Sep 2026
Down 3.8% since Oct 2025
Median price
$1,032,500
Oct 2025Sep 2026
Up 72.9% since Oct 2025
Homes sold
6
Oct 2025Sep 2026
Range 1 to 13
Active listings
17
Oct 2025Sep 2026
Range 11 to 27
Months of supply
2.8
Oct 2025Sep 2026
Range 1.6 to 24.0
Sold vs asking
97.0%
Oct 2025Sep 2026
Range 95.0% to 100.0%
Last 12 monthsSame months a year earlier (dashed)
View the monthly numbers
Month
Benchmark price
Sold
New listings
Active listings
Months of supply
Days on market
Median price
Average price
Sold vs asking
Oct 2025
$766,700
1
11
24
24.0
102
$597,000
$597,000
100.0%
Nov 2025
$757,500
7
6
19
2.7
60
$885,000
$870,500
97.0%
Dec 2025
$746,300
4
2
13
3.3
54
$666,000
$646,000
98.0%
Jan 2026
$755,500
7
8
11
1.6
61
$975,000
$1,065,414
98.0%
Feb 2026
$752,800
2
9
16
8.0
47
$1,120,500
$1,120,500
99.0%
Mar 2026
$756,100
4
15
26
6.5
20
$741,000
$836,750
98.0%
Apr 2026
$762,600
7
14
27
3.9
45
$975,000
$906,321
99.0%
May 2026
$754,800
13
16
21
1.6
41
$780,000
$807,885
97.0%
Jun 2026
$758,600
4
14
23
5.8
50
$940,000
$957,500
95.0%
Jul 2026
$753,900
8
11
20
2.5
39
$777,000
$900,750
98.0%
Aug 2026
$748,200
2
8
20
10.0
47
$699,750
$699,750
98.0%
Sep 2026
$737,400
6
10
17
2.8
40
$1,032,500
$1,002,450
97.0%
Source: Calgary Real Estate Board (CREB®) monthly statistics. Benchmark price is the typical price of a home in the area. Median and average prices are for homes that sold in the month. Figures can be revised.
Coopers Crossing is named for the Cooper family, who settled and farmed this land in Airdrie starting in 1892 for more than a century before it was developed by WestMark. The Reynolds Clock Tower at Cooper's Town Promenade honours the Reynolds family, from whom WestMark purchased the land. The Cooper's Crossing Residents' Association, formed in 1999, was one of the first of its kind in Airdrie and helps maintain the community's parks, ponds, and playgrounds. Builders including McKee Homes, Lifestyle Homes, NuVista Homes, and Harder Homes have built attached homes, single-family houses, and estate homes here. Six schools are within walking distance, including Cooper's Crossing School and St. Veronica School. Cooper's Town Promenade adds breweries and restaurants, and Sierra Springs Supercentre brings big-box shopping close by, with mountain views to the west and an easy Highway 2 commute to Calgary.
Sign Up For A Free Airdrie Real Estate Market Report!
Be a smart homeowner. Whether you are looking to buy or looking to sell, knowing your market makes a difference in your pocket.
By signing up, you will receive a customized report, every month. This report gives you a 12-month summary with exclusive insights into Airdrie real estate and your neighbourhood of choice.
The power of this report gives you special insights into information like average and median prices. Get to know what has sold and at what price in your neighborhood, and see where they are on Google Maps!
The community is named for the Cooper family, who settled and farmed this land starting in 1892 and worked it for more than a century, while the nearby Reynolds Clock Tower honours the Reynolds family, from whom developer WestMark purchased the land.
What schools serve Coopers Crossing?
Six schools are within walking distance, including Cooper's Crossing School (K-8) and St. Veronica School in the Calgary Catholic system, with W.H. Croxford and St. Martin de Porres high schools also nearby.
What shopping and recreation are near Coopers Crossing?
Residents are close to Cooper's Town Promenade for dining and breweries, Sierra Springs Supercentre for big-box shopping, and Chinook Winds Regional Park for tobogganing, splash pad, and sports facilities.