
Applewood Park East Calgary MLS® Listings
Houses, Condos and Real Estate For Sale.
East Calgary Market Snapshot
Applewood had too few sales in September 2026 for community-level statistics, so this snapshot shows East Calgary, the district it belongs to.
September 2026 · all residential property types
In September 2026, the benchmark price for East Calgary was $390,600, down 4.7% from September last year. 54 homes sold (down 4%), 98 new listings came on the market (down 16%), and there were 219 active listings at month end (down 8%). Among homes that sold, the median sale price was $434,500 (down 2.0%) and the average sale price was $420,662 (down 2.9%), and homes sold for 97.0% of their asking price. That is 4.1 months of supply, and homes spent 42 days on the market (down 6 days). Figures cover all residential property types.
View the numbers
| Measure | September 2026 | September last year |
|---|---|---|
| Benchmark price | $390,600 | $409,700 |
| Median price | $434,500 | $443,250 |
| Average price | $420,662 | $433,102 |
| Sold vs asking | 97.0% | 97.0% |
| Homes sold | 54 | 56 |
| New listings | 98 | 117 |
| Active listings | 219 | 239 |
| Months of supply | 4.1 | 4.3 |
| Days on market | 42 | 48 |
12-month trend
View the monthly numbers
| Month | Benchmark price | Sold | New listings | Active listings | Months of supply | Days on market | Median price | Average price | Sold vs asking |
|---|---|---|---|---|---|---|---|---|---|
| Oct 2025 | $406,500 | 70 | 131 | 246 | 3.5 | 43 | $441,400 | $421,709 | 97.0% |
| Nov 2025 | $413,000 | 58 | 85 | 208 | 3.6 | 67 | $455,500 | $443,315 | 97.0% |
| Dec 2025 | $409,300 | 34 | 45 | 155 | 4.6 | 64 | $472,500 | $432,648 | 98.0% |
| Jan 2026 | $411,500 | 31 | 86 | 161 | 5.2 | 63 | $430,000 | $406,516 | 97.0% |
| Feb 2026 | $402,200 | 58 | 101 | 159 | 2.7 | 45 | $447,500 | $418,433 | 97.0% |
| Mar 2026 | $410,200 | 56 | 87 | 154 | 2.8 | 39 | $445,200 | $435,197 | 97.0% |
| Apr 2026 | $399,100 | 42 | 124 | 199 | 4.7 | 34 | $437,000 | $425,013 | 99.0% |
| May 2026 | $400,800 | 51 | 133 | 230 | 4.5 | 36 | $460,000 | $419,811 | 97.0% |
| Jun 2026 | $399,600 | 55 | 134 | 248 | 4.5 | 40 | $464,000 | $444,765 | 97.0% |
| Jul 2026 | $398,800 | 53 | 101 | 234 | 4.4 | 43 | $406,000 | $373,773 | 96.0% |
| Aug 2026 | $398,600 | 55 | 114 | 237 | 4.3 | 43 | $435,000 | $409,223 | 96.0% |
| Sep 2026 | $390,600 | 54 | 98 | 219 | 4.1 | 42 | $434,500 | $420,662 | 97.0% |
September 2026 · detached homes
In September 2026, the benchmark price for East Calgary was $476,200, down 5.0% from September last year. 33 homes sold (up 10%), 58 new listings came on the market (down 15%), and there were 110 active listings at month end (down 11%). Among homes that sold, the median sale price was $484,500 (down 2.2%) and the average sale price was $492,705 (down 3.8%), and homes sold for 98.0% of their asking price. That is 3.3 months of supply, and homes spent 40 days on the market (down 9 days). Figures cover detached homes.
View the numbers
| Measure | September 2026 | September last year |
|---|---|---|
| Benchmark price | $476,200 | $501,200 |
| Median price | $484,500 | $495,500 |
| Average price | $492,705 | $512,067 |
| Sold vs asking | 98.0% | 97.0% |
| Homes sold | 33 | 30 |
| New listings | 58 | 68 |
| Active listings | 110 | 124 |
| Months of supply | 3.3 | 4.1 |
| Days on market | 40 | 49 |
12-month trend
View the monthly numbers
| Month | Benchmark price | Sold | New listings | Active listings | Months of supply | Days on market | Median price | Average price | Sold vs asking |
|---|---|---|---|---|---|---|---|---|---|
| Oct 2025 | $497,700 | 41 | 59 | 111 | 2.7 | 43 | $493,000 | $507,822 | 97.0% |
| Nov 2025 | $507,000 | 33 | 35 | 87 | 2.6 | 49 | $500,000 | $513,250 | 98.0% |
| Dec 2025 | $505,000 | 16 | 21 | 69 | 4.3 | 71 | $530,100 | $535,512 | 99.0% |
| Jan 2026 | $509,700 | 13 | 42 | 73 | 5.6 | 58 | $520,000 | $546,696 | 97.0% |
| Feb 2026 | $497,500 | 33 | 47 | 72 | 2.2 | 40 | $465,000 | $480,032 | 97.0% |
| Mar 2026 | $504,500 | 32 | 36 | 58 | 1.8 | 36 | $486,125 | $514,661 | 98.0% |
| Apr 2026 | $487,500 | 26 | 63 | 81 | 3.1 | 28 | $471,000 | $494,418 | 99.0% |
| May 2026 | $489,100 | 27 | 65 | 100 | 3.7 | 26 | $500,000 | $506,489 | 98.0% |
| Jun 2026 | $489,400 | 32 | 74 | 116 | 3.6 | 39 | $500,000 | $530,284 | 97.0% |
| Jul 2026 | $490,200 | 25 | 60 | 120 | 4.8 | 35 | $465,000 | $473,396 | 97.0% |
| Aug 2026 | $489,500 | 33 | 62 | 123 | 3.7 | 39 | $478,000 | $507,966 | 97.0% |
| Sep 2026 | $476,200 | 33 | 58 | 110 | 3.3 | 40 | $484,500 | $492,705 | 98.0% |
September 2026 · semi-detached homes
In September 2026, the benchmark price for East Calgary was $368,600, down 5.0% from September last year. 8 homes sold (unchanged), 9 new listings came on the market (down 40%), and there were 25 active listings at month end (down 14%). Among homes that sold, the median sale price was $367,500 (down 12.4%) and the average sale price was $392,562 (down 13.3%), and homes sold for 96.0% of their asking price. That is 3.1 months of supply, and homes spent 35 days on the market (down 13 days). Figures cover semi-detached homes.
View the numbers
| Measure | September 2026 | September last year |
|---|---|---|
| Benchmark price | $368,600 | $388,100 |
| Median price | $367,500 | $419,350 |
| Average price | $392,562 | $452,712 |
| Sold vs asking | 96.0% | 97.0% |
| Homes sold | 8 | 8 |
| New listings | 9 | 15 |
| Active listings | 25 | 29 |
| Months of supply | 3.1 | 3.6 |
| Days on market | 35 | 48 |
12-month trend
View the monthly numbers
| Month | Benchmark price | Sold | New listings | Active listings | Months of supply | Days on market | Median price | Average price | Sold vs asking |
|---|---|---|---|---|---|---|---|---|---|
| Oct 2025 | $390,700 | 10 | 18 | 33 | 3.3 | 28 | $402,000 | $397,250 | 99.0% |
| Nov 2025 | $393,400 | 9 | 11 | 28 | 3.1 | 70 | $460,000 | $458,389 | 97.0% |
| Dec 2025 | $390,900 | 6 | 5 | 19 | 3.2 | 60 | $422,500 | $447,292 | 98.0% |
| Jan 2026 | $397,500 | 2 | 12 | 23 | 11.5 | 38 | $379,500 | $379,500 | 96.0% |
| Feb 2026 | $388,900 | 8 | 9 | 14 | 1.8 | 55 | $379,000 | $447,112 | 97.0% |
| Mar 2026 | $392,900 | 5 | 15 | 20 | 4.0 | 39 | $433,000 | $425,196 | 96.0% |
| Apr 2026 | $384,500 | 3 | 13 | 23 | 7.7 | 56 | $410,000 | $413,333 | 97.0% |
| May 2026 | $385,500 | 12 | 16 | 22 | 1.8 | 45 | $403,000 | $424,700 | 94.0% |
| Jun 2026 | $384,100 | 7 | 14 | 23 | 3.3 | 35 | $444,000 | $445,786 | 97.0% |
| Jul 2026 | $381,900 | 7 | 9 | 21 | 3.0 | 30 | $385,000 | $405,643 | 97.0% |
| Aug 2026 | $377,400 | 3 | 19 | 31 | 10.3 | 29 | $425,000 | $448,000 | 98.0% |
| Sep 2026 | $368,600 | 8 | 9 | 25 | 3.1 | 35 | $367,500 | $392,562 | 96.0% |
September 2026 · row and townhouse homes
In September 2026, the benchmark price for East Calgary was $258,300, down 12.5% from September last year. 3 homes sold (down 75%), 21 new listings came on the market (up 75%), and there were 41 active listings at month end (up 24%). Among homes that sold, the median sale price was $295,000 (up 5.2%) and the average sale price was $325,000 (up 4.9%), and homes sold for 97.0% of their asking price. That is 13.7 months of supply, and homes spent 52 days on the market (up 7 days). Figures cover row and townhouse homes.
View the numbers
| Measure | September 2026 | September last year |
|---|---|---|
| Benchmark price | $258,300 | $295,300 |
| Median price | $295,000 | $280,500 |
| Average price | $325,000 | $309,875 |
| Sold vs asking | 97.0% | 96.0% |
| Homes sold | 3 | 12 |
| New listings | 21 | 12 |
| Active listings | 41 | 33 |
| Months of supply | 13.7 | 2.8 |
| Days on market | 52 | 45 |
12-month trend
View the monthly numbers
| Month | Benchmark price | Sold | New listings | Active listings | Months of supply | Days on market | Median price | Average price | Sold vs asking |
|---|---|---|---|---|---|---|---|---|---|
| Oct 2025 | $286,700 | 4 | 32 | 51 | 12.8 | 9 | $245,500 | $248,948 | 96.0% |
| Nov 2025 | $288,300 | 8 | 20 | 43 | 5.4 | 163 | $356,905 | $338,064 | 96.0% |
| Dec 2025 | $280,400 | 5 | 9 | 29 | 5.8 | 56 | $400,000 | $351,780 | 94.0% |
| Jan 2026 | $272,200 | 8 | 19 | 30 | 3.8 | 66 | $382,450 | $367,007 | 99.0% |
| Feb 2026 | $265,800 | 11 | 26 | 34 | 3.1 | 44 | $270,000 | $313,300 | 96.0% |
| Mar 2026 | $273,300 | 14 | 19 | 34 | 2.4 | 42 | $311,500 | $328,442 | 98.0% |
| Apr 2026 | $269,300 | 9 | 32 | 47 | 5.2 | 44 | $285,000 | $302,311 | 96.0% |
| May 2026 | $273,200 | 3 | 29 | 59 | 19.7 | 26 | $218,000 | $251,330 | 103.0% |
| Jun 2026 | $274,900 | 8 | 19 | 52 | 6.5 | 46 | $247,500 | $293,936 | 96.0% |
| Jul 2026 | $261,200 | 10 | 12 | 38 | 3.8 | 60 | $254,500 | $285,385 | 97.0% |
| Aug 2026 | $259,400 | 9 | 12 | 29 | 3.2 | 45 | $250,000 | $279,055 | 95.0% |
| Sep 2026 | $258,300 | 3 | 21 | 41 | 13.7 | 52 | $295,000 | $325,000 | 97.0% |
September 2026 · apartment condos
In September 2026, the benchmark price for East Calgary was $209,800, down 13.1% from September last year. 10 homes sold (up 67%), 10 new listings came on the market (down 55%), and there were 43 active listings at month end (down 19%). Among homes that sold, the median sale price was $256,995 (down 1.5%) and the average sale price was $234,099 (down 9.5%), and homes sold for 96.0% of their asking price. That is 4.3 months of supply, and homes spent 53 days on the market (down 0 days). Figures cover apartment condos.
View the numbers
| Measure | September 2026 | September last year |
|---|---|---|
| Benchmark price | $209,800 | $241,500 |
| Median price | $256,995 | $261,000 |
| Average price | $234,099 | $258,583 |
| Sold vs asking | 96.0% | 97.0% |
| Homes sold | 10 | 6 |
| New listings | 10 | 22 |
| Active listings | 43 | 53 |
| Months of supply | 4.3 | 8.8 |
| Days on market | 53 | 53 |
12-month trend
View the monthly numbers
| Month | Benchmark price | Sold | New listings | Active listings | Months of supply | Days on market | Median price | Average price | Sold vs asking |
|---|---|---|---|---|---|---|---|---|---|
| Oct 2025 | $236,100 | 15 | 22 | 51 | 3.4 | 61 | $250,000 | $248,707 | 98.0% |
| Nov 2025 | $231,700 | 8 | 19 | 50 | 6.3 | 43 | $237,000 | $243,125 | 96.0% |
| Dec 2025 | $228,100 | 7 | 10 | 38 | 5.4 | 59 | $199,900 | $242,743 | 97.0% |
| Jan 2026 | $226,600 | 8 | 13 | 35 | 4.4 | 73 | $228,000 | $224,988 | 98.0% |
| Feb 2026 | $220,500 | 6 | 19 | 39 | 6.5 | 61 | $224,500 | $234,148 | 97.0% |
| Mar 2026 | $225,300 | 5 | 17 | 42 | 8.4 | 49 | $221,800 | $235,540 | 94.0% |
| Apr 2026 | $222,800 | 4 | 16 | 48 | 12.0 | 34 | $266,950 | $258,722 | 101.0% |
| May 2026 | $219,800 | 9 | 23 | 49 | 5.4 | 57 | $198,000 | $209,418 | 97.0% |
| Jun 2026 | $214,500 | 8 | 27 | 57 | 7.1 | 42 | $246,500 | $252,624 | 97.0% |
| Jul 2026 | $213,100 | 11 | 20 | 55 | 5.0 | 52 | $205,000 | $207,432 | 92.0% |
| Aug 2026 | $211,100 | 10 | 21 | 54 | 5.4 | 59 | $169,000 | $188,889 | 94.0% |
| Sep 2026 | $209,800 | 10 | 10 | 43 | 4.3 | 53 | $256,995 | $234,099 | 96.0% |
Source: Calgary Real Estate Board (CREB®) monthly statistics. Benchmark price is the typical price of a home in the area. Median and average prices are for homes that sold in the month. Figures can be revised.
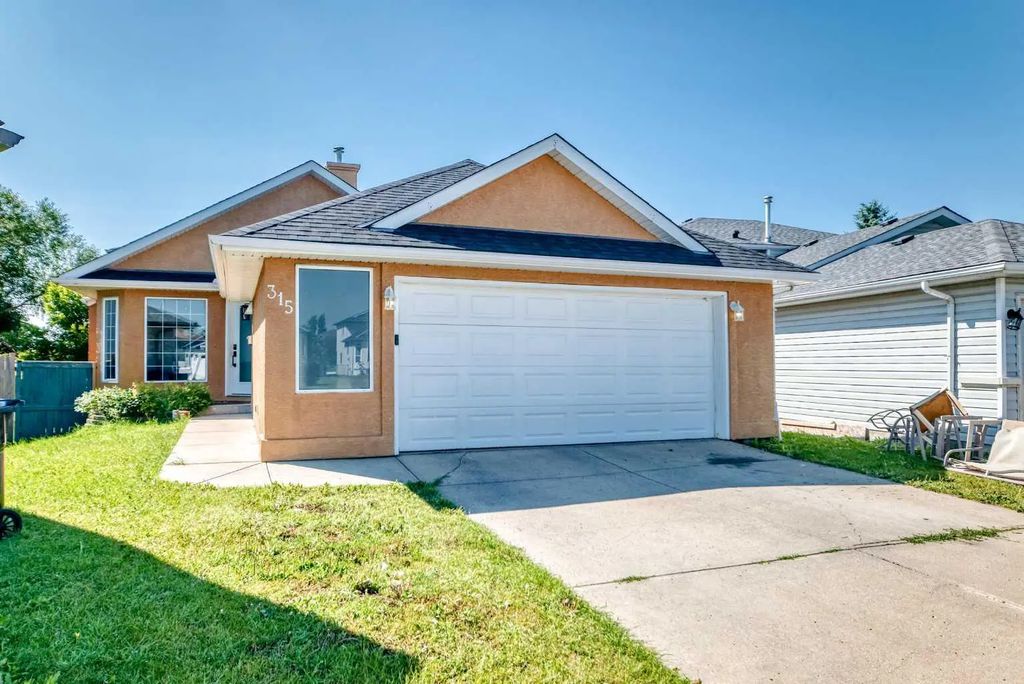
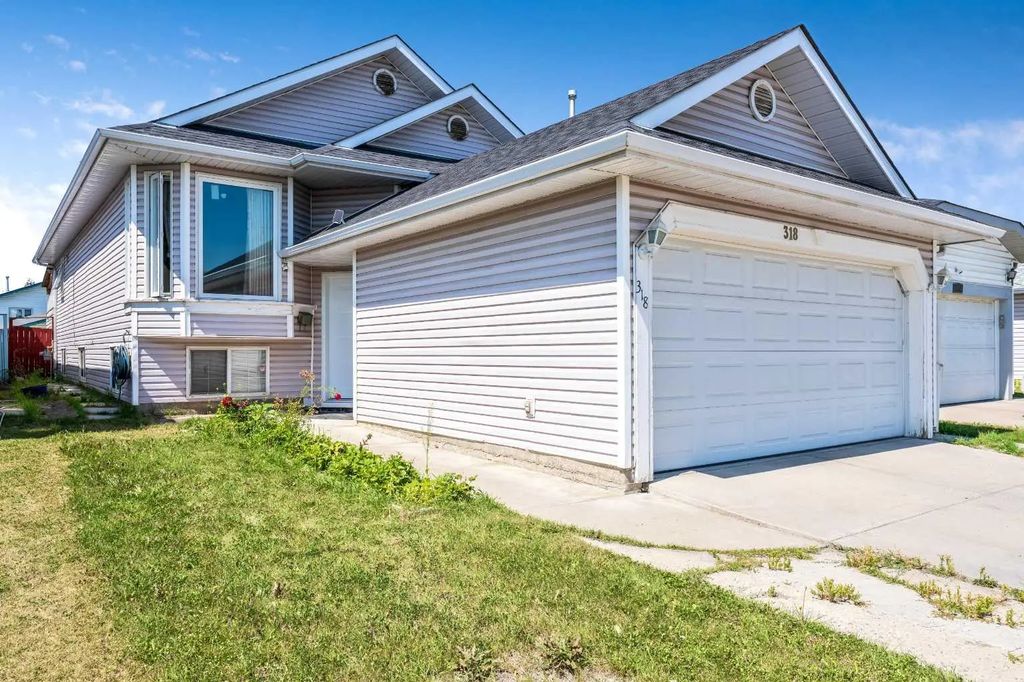
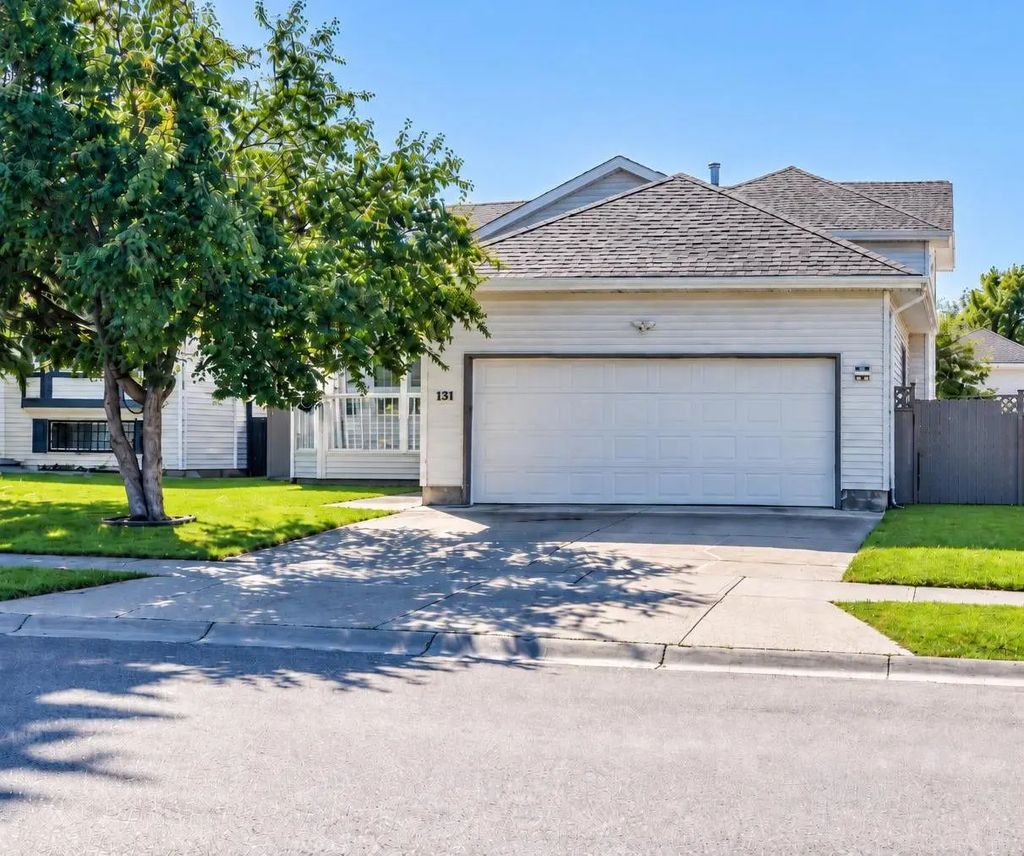
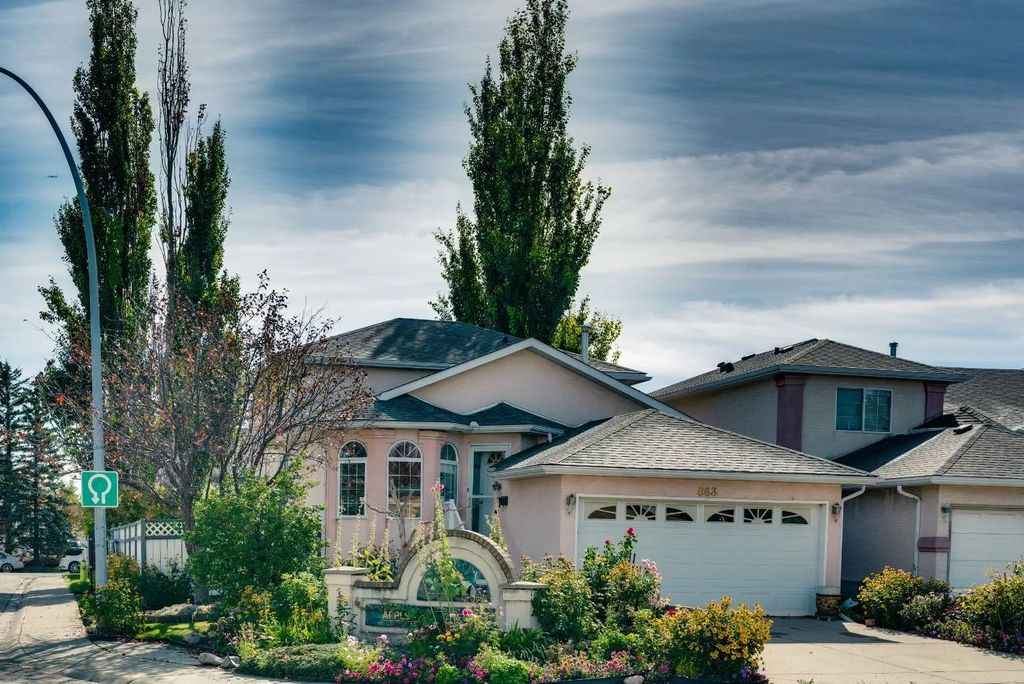
Applewood Park is a family-oriented community in southeast Calgary that took shape in the early 1980s, largely built out through the 1990s along 17 Avenue SE near the city's eastern edge. It is known for its cultural diversity, larger homes on generous lots and a strong sense of community, with more than 2,000 children living in the area according to the local community association. Elliston Park, home to the annual GlobalFest fireworks and a scenic pond and pathway system, sits just southwest of the neighbourhood. The nearby International Avenue business corridor offers hundreds of shops, restaurants and the Fuse 33 maker space. The MAX Purple bus rapid transit line runs along 17 Avenue SE through the area, giving residents a fast, direct connection to downtown Calgary without needing a vehicle.

Sign Up For A Free Calgary Real Estate Market Report!
Be a smart homeowner. Whether you are looking to buy or looking to sell, knowing your market makes a difference in your pocket. By signing up, you will receive a customized report, every month. This report gives you a 12-month summary with exclusive insights into Calgary real estate and your neighbourhood of choice.
The power of this report gives you special insights into information like average and median prices. Get to know what has sold and at what price in your neighborhood, and see where they are on Google Maps!
Get Your Free Market ReportApplewood NE Calgary Real Estate Listings - Homes, Condos and Townhouses For Sale
- All Listings
- $100,000 - $200,000
- $200,000 - $300,000
- $400,000 - $500,000
- $500,000 - $600,000
- $600,000 - $700,000







Frequently Asked Questions About Applewood Park
What makes Applewood Park a good community for families?
Applewood Park has a high concentration of children and larger single-family homes on generous lots, many with double-car garages. The community association reports more than 2,000 children living in the area, and Elliston Park nearby offers playgrounds, pathways and open green space.
How do residents get around from Applewood Park?
The MAX Purple bus rapid transit line runs along 17 Avenue SE through the community, providing a direct, dedicated-lane connection to downtown Calgary. The area is also close to Stoney Trail and Glenmore Trail for drivers.
What is the International Avenue area near Applewood Park like?
International Avenue along 17 Avenue SE is a busy business corridor with hundreds of independent shops and restaurants reflecting the area's cultural diversity. It also includes public art installations and the Fuse 33 community maker space.