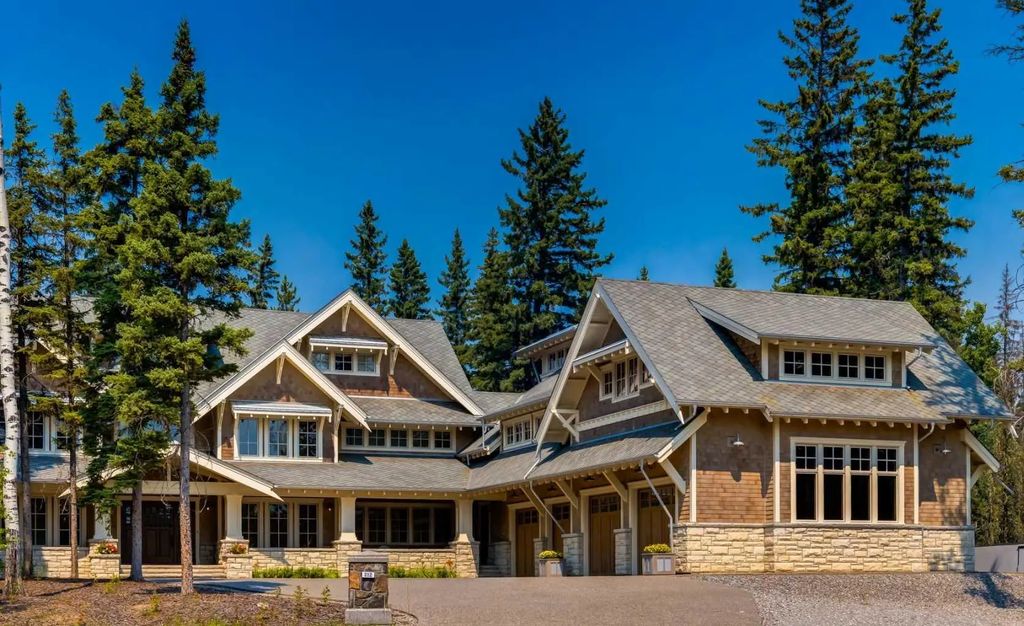
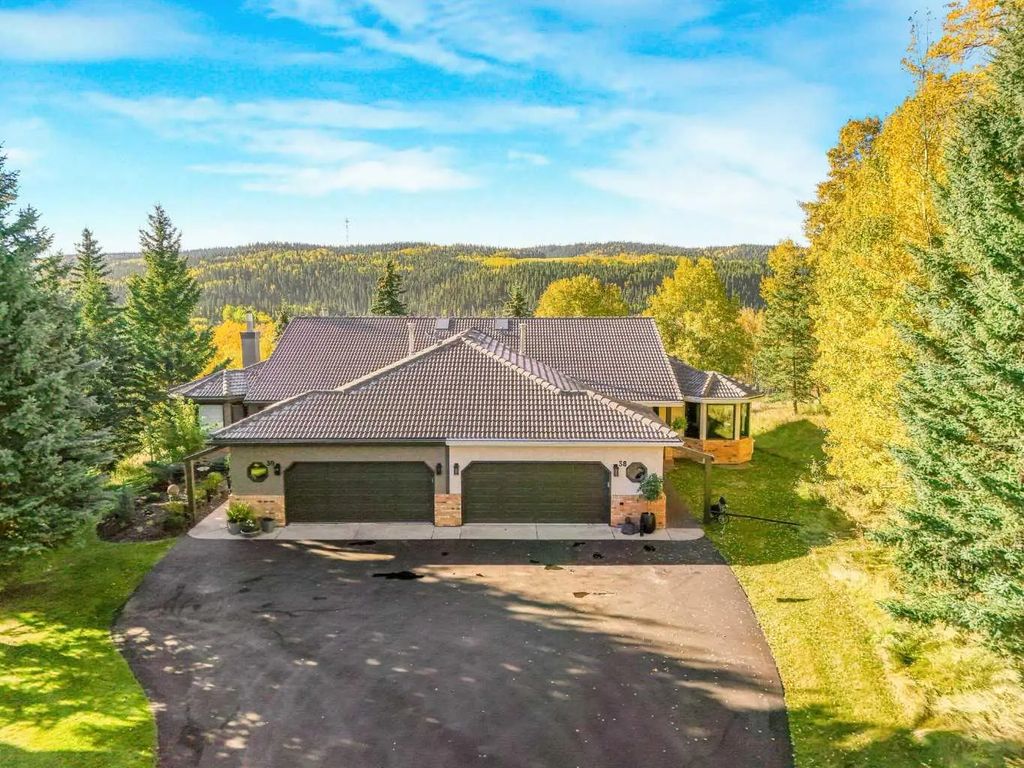
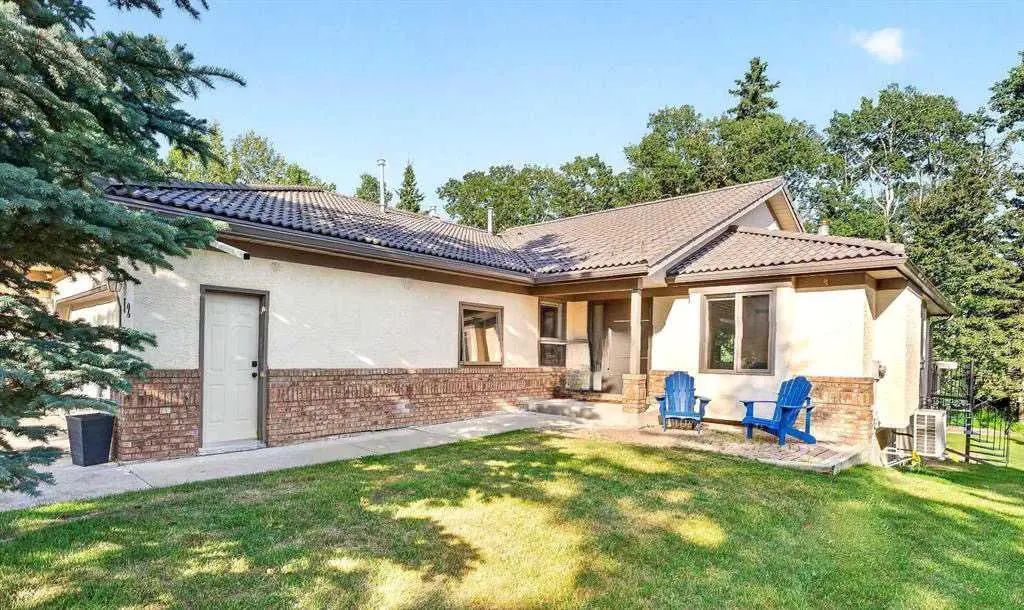
Houses, Condos, Acreages and Real Estate For sale.
Foothills Market Snapshot
Priddis Greens had too few sales in September 2026 for community-level statistics, so this snapshot shows Foothills, the area it belongs to.
September 2026 · all residential property types
Benchmark price
$674,100
▲ 0.9% vs September
Median price
$680,000
▲ 13.4% vs September
Average price
$883,889
▲ 15.5% vs September
Sold vs asking
98.0%
▬ No change vs September
Homes sold
121
▲ 7% vs September
New listings
180
▲ 13% vs September
Active listings
346
▲ 9% vs September
Months of supply
2.9
▲ 0.1 vs September
Days on market
42
▲ 3 days vs September
September 2026September last year
In September 2026, the benchmark price for Foothills was $674,100, up 0.9% from September last year. 121 homes sold (up 7%), 180 new listings came on the market (up 13%), and there were 346 active listings at month end (up 9%). Among homes that sold, the median sale price was $680,000 (up 13.4%) and the average sale price was $883,889 (up 15.5%), and homes sold for 98.0% of their asking price. That is 2.9 months of supply, and homes spent 42 days on the market (up 3 days). Figures cover all residential property types.
View the numbers
Measure
September 2026
September last year
Benchmark price
$674,100
$668,000
Median price
$680,000
$599,900
Average price
$883,889
$765,160
Sold vs asking
98.0%
98.0%
Homes sold
121
113
New listings
180
159
Active listings
346
316
Months of supply
2.9
2.8
Days on market
42
39
12-month trend
Benchmark price
$674,100
Oct 2025Sep 2026
Down 0.5% since Oct 2025
Median price
$680,000
Oct 2025Sep 2026
Up 11.1% since Oct 2025
Homes sold
121
Oct 2025Sep 2026
Range 63 to 158
Active listings
346
Oct 2025Sep 2026
Range 182 to 376
Months of supply
2.9
Oct 2025Sep 2026
Range 2.4 to 3.3
Sold vs asking
98.0%
Oct 2025Sep 2026
Range 96.0% to 99.0%
Last 12 monthsSame months a year earlier (dashed)
View the monthly numbers
Month
Benchmark price
Sold
New listings
Active listings
Months of supply
Days on market
Median price
Average price
Sold vs asking
Oct 2025
$677,500
106
154
305
2.9
43
$612,000
$712,006
98.0%
Nov 2025
$659,700
104
117
262
2.5
49
$591,750
$716,775
98.0%
Dec 2025
$657,700
63
47
182
2.9
60
$655,000
$871,751
96.0%
Jan 2026
$659,500
64
104
193
3.0
52
$587,500
$748,306
98.0%
Feb 2026
$674,800
69
129
230
3.3
55
$585,000
$753,362
98.0%
Mar 2026
$676,700
103
182
271
2.6
51
$662,500
$840,849
98.0%
Apr 2026
$687,800
118
213
318
2.7
30
$730,000
$891,562
99.0%
May 2026
$685,600
158
257
376
2.4
38
$688,500
$809,534
98.0%
Jun 2026
$693,000
149
210
371
2.5
32
$680,000
$864,757
98.0%
Jul 2026
$690,400
137
194
366
2.7
35
$627,500
$741,733
98.0%
Aug 2026
$679,600
116
156
361
3.1
47
$629,750
$714,015
98.0%
Sep 2026
$674,100
121
180
346
2.9
42
$680,000
$883,889
98.0%
September 2026 · detached homes
Benchmark price
$761,900
▲ 0.1% vs September
Median price
$750,000
▲ 10.3% vs September
Average price
$1,047,366
▲ 18.9% vs September
Sold vs asking
98.0%
▬ No change vs September
Homes sold
86
▼ 1% vs September
New listings
137
▲ 9% vs September
Active listings
253
▲ 2% vs September
Months of supply
2.9
▲ 0.1 vs September
Days on market
42
▲ 2 days vs September
September 2026September last year
In September 2026, the benchmark price for Foothills was $761,900, up 0.1% from September last year. 86 homes sold (down 1%), 137 new listings came on the market (up 9%), and there were 253 active listings at month end (up 2%). Among homes that sold, the median sale price was $750,000 (up 10.3%) and the average sale price was $1,047,366 (up 18.9%), and homes sold for 98.0% of their asking price. That is 2.9 months of supply, and homes spent 42 days on the market (up 2 days). Figures cover detached homes.
View the numbers
Measure
September 2026
September last year
Benchmark price
$761,900
$761,000
Median price
$750,000
$680,000
Average price
$1,047,366
$880,974
Sold vs asking
98.0%
98.0%
Homes sold
86
87
New listings
137
126
Active listings
253
248
Months of supply
2.9
2.9
Days on market
42
40
12-month trend
Benchmark price
$761,900
Oct 2025Sep 2026
Down 1.4% since Oct 2025
Median price
$750,000
Oct 2025Sep 2026
Up 7.1% since Oct 2025
Homes sold
86
Oct 2025Sep 2026
Range 42 to 117
Active listings
253
Oct 2025Sep 2026
Range 131 to 271
Months of supply
2.9
Oct 2025Sep 2026
Range 2.3 to 3.8
Sold vs asking
98.0%
Oct 2025Sep 2026
Range 96.0% to 99.0%
Last 12 monthsSame months a year earlier (dashed)
View the monthly numbers
Month
Benchmark price
Sold
New listings
Active listings
Months of supply
Days on market
Median price
Average price
Sold vs asking
Oct 2025
$772,500
77
108
232
3.0
38
$700,000
$821,883
98.0%
Nov 2025
$752,600
73
79
199
2.7
56
$717,400
$855,571
97.0%
Dec 2025
$750,300
53
34
131
2.5
65
$729,900
$940,055
96.0%
Jan 2026
$754,200
42
74
142
3.4
51
$675,000
$945,735
98.0%
Feb 2026
$776,000
46
97
175
3.8
62
$682,000
$930,145
98.0%
Mar 2026
$773,000
76
144
213
2.8
57
$708,500
$970,218
98.0%
Apr 2026
$782,600
94
149
231
2.5
31
$799,000
$964,964
99.0%
May 2026
$780,300
117
189
270
2.3
40
$750,300
$908,215
98.0%
Jun 2026
$787,700
111
153
269
2.4
34
$769,900
$987,826
98.0%
Jul 2026
$783,700
99
151
271
2.7
34
$725,000
$850,967
98.0%
Aug 2026
$772,300
78
96
255
3.3
45
$709,750
$818,027
98.0%
Sep 2026
$761,900
86
137
253
2.9
42
$750,000
$1,047,366
98.0%
September 2026 · semi-detached homes
Benchmark price
$521,400
▼ 0.5% vs September
Median price
$529,950
▲ 3.9% vs September
Average price
$630,538
▲ 27.1% vs September
Sold vs asking
98.0%
▼ 1.0 pts vs September
Homes sold
18
▲ 200% vs September
New listings
13
▲ 44% vs September
Active listings
30
▲ 50% vs September
Months of supply
1.7
▼ 1.7 vs September
Days on market
40
▲ 7 days vs September
September 2026September last year
In September 2026, the benchmark price for Foothills was $521,400, down 0.5% from September last year. 18 homes sold (up 200%), 13 new listings came on the market (up 44%), and there were 30 active listings at month end (up 50%). Among homes that sold, the median sale price was $529,950 (up 3.9%) and the average sale price was $630,538 (up 27.1%), and homes sold for 98.0% of their asking price. That is 1.7 months of supply, and homes spent 40 days on the market (up 7 days). Figures cover semi-detached homes.
View the numbers
Measure
September 2026
September last year
Benchmark price
$521,400
$524,100
Median price
$529,950
$510,000
Average price
$630,538
$496,000
Sold vs asking
98.0%
99.0%
Homes sold
18
6
New listings
13
9
Active listings
30
20
Months of supply
1.7
3.3
Days on market
40
33
12-month trend
Benchmark price
$521,400
Oct 2025Sep 2026
Down 2.0% since Oct 2025
Median price
$529,950
Oct 2025Sep 2026
Down 11.7% since Oct 2025
Homes sold
18
Oct 2025Sep 2026
Range 5 to 18
Active listings
30
Oct 2025Sep 2026
Range 14 to 42
Months of supply
1.7
Oct 2025Sep 2026
Range 1.7 to 3.9
Sold vs asking
98.0%
Oct 2025Sep 2026
Range 97.0% to 100.0%
Last 12 monthsSame months a year earlier (dashed)
View the monthly numbers
Month
Benchmark price
Sold
New listings
Active listings
Months of supply
Days on market
Median price
Average price
Sold vs asking
Oct 2025
$532,300
12
15
20
1.7
71
$600,000
$568,725
98.0%
Nov 2025
$514,500
7
13
18
2.6
23
$556,000
$552,571
97.0%
Dec 2025
$507,200
5
4
14
2.8
29
$548,000
$543,675
98.0%
Jan 2026
$506,600
5
10
18
3.6
62
$515,000
$517,980
98.0%
Feb 2026
$518,700
7
16
27
3.9
24
$578,000
$526,700
98.0%
Mar 2026
$538,500
10
11
23
2.3
40
$680,950
$666,030
100.0%
Apr 2026
$545,100
9
26
33
3.7
18
$740,000
$1,016,811
99.0%
May 2026
$534,700
17
28
42
2.5
41
$565,000
$718,308
99.0%
Jun 2026
$540,200
18
26
38
2.1
24
$569,950
$635,828
99.0%
Jul 2026
$535,700
14
17
38
2.7
27
$557,500
$647,578
97.0%
Aug 2026
$525,300
17
22
40
2.4
60
$559,000
$629,347
98.0%
Sep 2026
$521,400
18
13
30
1.7
40
$529,950
$630,538
98.0%
September 2026 · row and townhouse homes
Benchmark price
$411,600
▼ 1.9% vs September
Median price
$277,500
▼ 17.2% vs September
Average price
$298,088
▼ 16.6% vs September
Sold vs asking
98.0%
▼ 1.0 pts vs September
Homes sold
8
▼ 38% vs September
New listings
19
▲ 58% vs September
Active listings
34
▲ 17% vs September
Months of supply
4.3
▲ 2.0 vs September
Days on market
32
▲ 3 days vs September
September 2026September last year
In September 2026, the benchmark price for Foothills was $411,600, down 1.9% from September last year. 8 homes sold (down 38%), 19 new listings came on the market (up 58%), and there were 34 active listings at month end (up 17%). Among homes that sold, the median sale price was $277,500 (down 17.2%) and the average sale price was $298,088 (down 16.6%), and homes sold for 98.0% of their asking price. That is 4.3 months of supply, and homes spent 32 days on the market (up 3 days). Figures cover row and townhouse homes.
View the numbers
Measure
September 2026
September last year
Benchmark price
$411,600
$419,700
Median price
$277,500
$335,000
Average price
$298,088
$357,531
Sold vs asking
98.0%
99.0%
Homes sold
8
13
New listings
19
12
Active listings
34
29
Months of supply
4.3
2.2
Days on market
32
29
12-month trend
Benchmark price
$411,600
Oct 2025Sep 2026
Down 1.1% since Oct 2025
Median price
$277,500
Oct 2025Sep 2026
Down 14.9% since Oct 2025
Homes sold
8
Oct 2025Sep 2026
Range 5 to 18
Active listings
34
Oct 2025Sep 2026
Range 15 to 37
Months of supply
4.3
Oct 2025Sep 2026
Range 1.6 to 5.3
Sold vs asking
98.0%
Oct 2025Sep 2026
Range 97.0% to 99.0%
Last 12 monthsSame months a year earlier (dashed)
View the monthly numbers
Month
Benchmark price
Sold
New listings
Active listings
Months of supply
Days on market
Median price
Average price
Sold vs asking
Oct 2025
$416,300
8
16
32
4.0
55
$326,250
$334,938
97.0%
Nov 2025
$406,000
13
15
26
2.0
40
$359,900
$362,954
98.0%
Dec 2025
$403,900
5
5
19
3.8
48
$455,000
$475,800
98.0%
Jan 2026
$395,400
10
12
18
1.8
50
$327,500
$324,750
99.0%
Feb 2026
$389,900
9
9
15
1.7
42
$330,000
$337,389
98.0%
Mar 2026
$415,900
10
13
16
1.6
44
$380,000
$400,450
98.0%
Apr 2026
$436,800
6
25
32
5.3
21
$411,200
$436,750
99.0%
May 2026
$422,700
18
26
37
2.1
20
$416,825
$423,608
99.0%
Jun 2026
$429,400
14
17
35
2.5
27
$385,000
$421,943
98.0%
Jul 2026
$422,600
10
13
32
3.2
26
$405,250
$392,550
98.0%
Aug 2026
$415,900
8
13
32
4.0
60
$357,050
$401,012
98.0%
Sep 2026
$411,600
8
19
34
4.3
32
$277,500
$298,088
98.0%
September 2026 · apartment condos
Benchmark price
$291,300
▲ 4.6% vs September
Median price
$330,000
▬ No change vs September
Average price
$349,195
▲ 11.4% vs September
Sold vs asking
98.0%
▲ 1.0 pts vs September
Homes sold
9
▲ 29% vs September
New listings
11
▼ 8% vs September
Active listings
29
▲ 53% vs September
Months of supply
3.2
▲ 0.5 vs September
Days on market
49
▼ 8 days vs September
September 2026September last year
In September 2026, the benchmark price for Foothills was $291,300, up 4.6% from September last year. 9 homes sold (up 29%), 11 new listings came on the market (down 8%), and there were 29 active listings at month end (up 53%). Among homes that sold, the median sale price was $330,000 (unchanged) and the average sale price was $349,195 (up 11.4%), and homes sold for 98.0% of their asking price. That is 3.2 months of supply, and homes spent 49 days on the market (down 8 days). Figures cover apartment condos.
View the numbers
Measure
September 2026
September last year
Benchmark price
$291,300
$278,400
Median price
$330,000
$330,000
Average price
$349,195
$313,500
Sold vs asking
98.0%
97.0%
Homes sold
9
7
New listings
11
12
Active listings
29
19
Months of supply
3.2
2.7
Days on market
49
57
12-month trend
Benchmark price
$291,300
Oct 2025Sep 2026
Up 2.1% since Oct 2025
Median price
$330,000
Oct 2025Sep 2026
Up 17.9% since Oct 2025
Homes sold
9
Oct 2025Sep 2026
Range 6 to 14
Active listings
29
Oct 2025Sep 2026
Range 13 to 34
Months of supply
3.2
Oct 2025Sep 2026
Range 1.7 to 4.8
Sold vs asking
98.0%
Oct 2025Sep 2026
Range 97.0% to 99.0%
Last 12 monthsSame months a year earlier (dashed)
View the monthly numbers
Month
Benchmark price
Sold
New listings
Active listings
Months of supply
Days on market
Median price
Average price
Sold vs asking
Oct 2025
$285,400
9
15
21
2.3
46
$280,000
$298,167
98.0%
Nov 2025
$282,900
11
10
19
1.7
22
$322,000
$318,323
99.0%
Dec 2025
$277,300
0
4
18
n/a
n/a
n/a
n/a
n/a
Jan 2026
$276,900
7
8
15
2.1
55
$340,000
$333,329
98.0%
Feb 2026
$269,900
7
7
13
1.9
61
$345,000
$353,129
98.0%
Mar 2026
$282,500
7
14
19
2.7
20
$317,000
$315,143
97.0%
Apr 2026
$283,500
9
13
22
2.4
33
$289,900
$302,878
98.0%
May 2026
$295,000
6
14
27
4.5
43
$336,050
$301,517
98.0%
Jun 2026
$291,500
6
14
29
4.8
30
$306,500
$308,000
97.0%
Jul 2026
$291,600
14
13
25
1.8
50
$312,500
$312,857
98.0%
Aug 2026
$284,600
13
25
34
2.6
36
$355,000
$393,277
98.0%
Sep 2026
$291,300
9
11
29
3.2
49
$330,000
$349,195
98.0%
Source: Calgary Real Estate Board (CREB®) monthly statistics. Benchmark price is the typical price of a home in the area. Median and average prices are for homes that sold in the month. Figures can be revised.