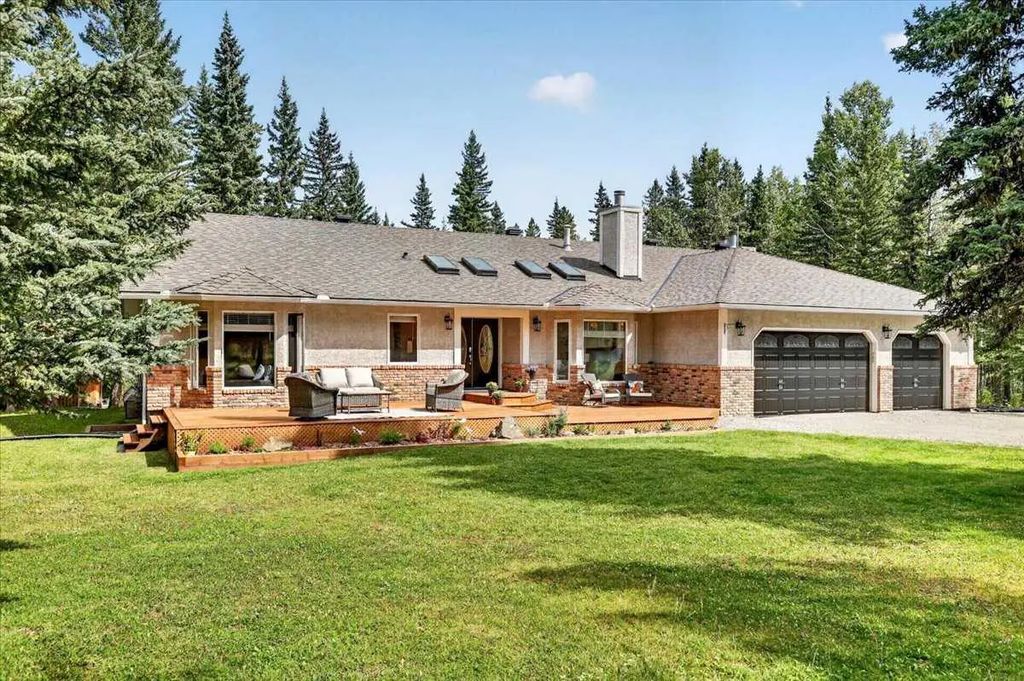
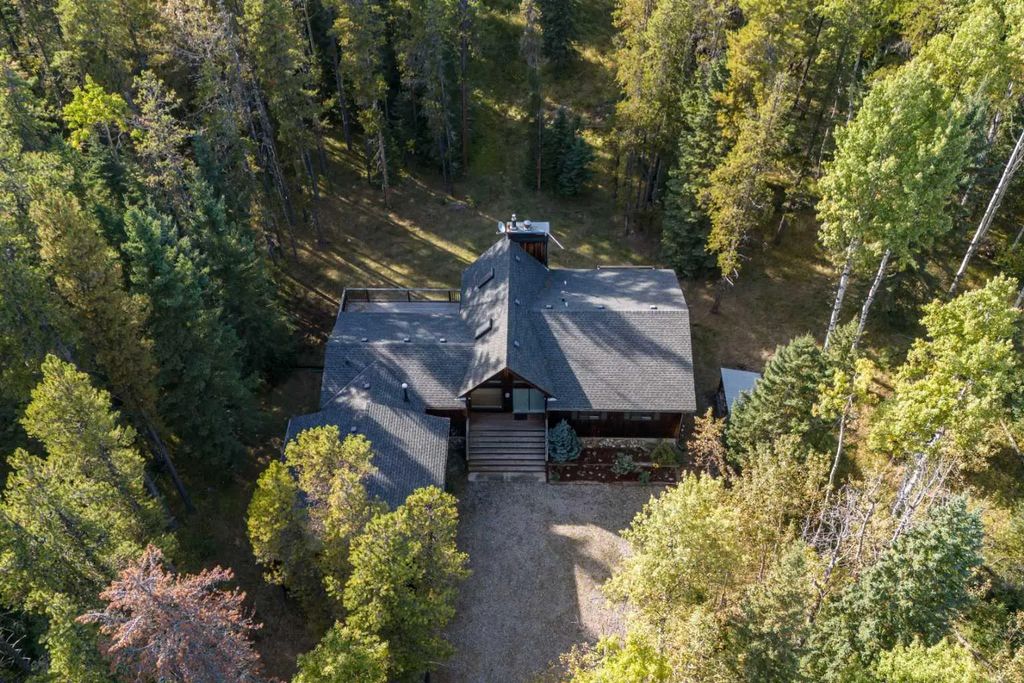
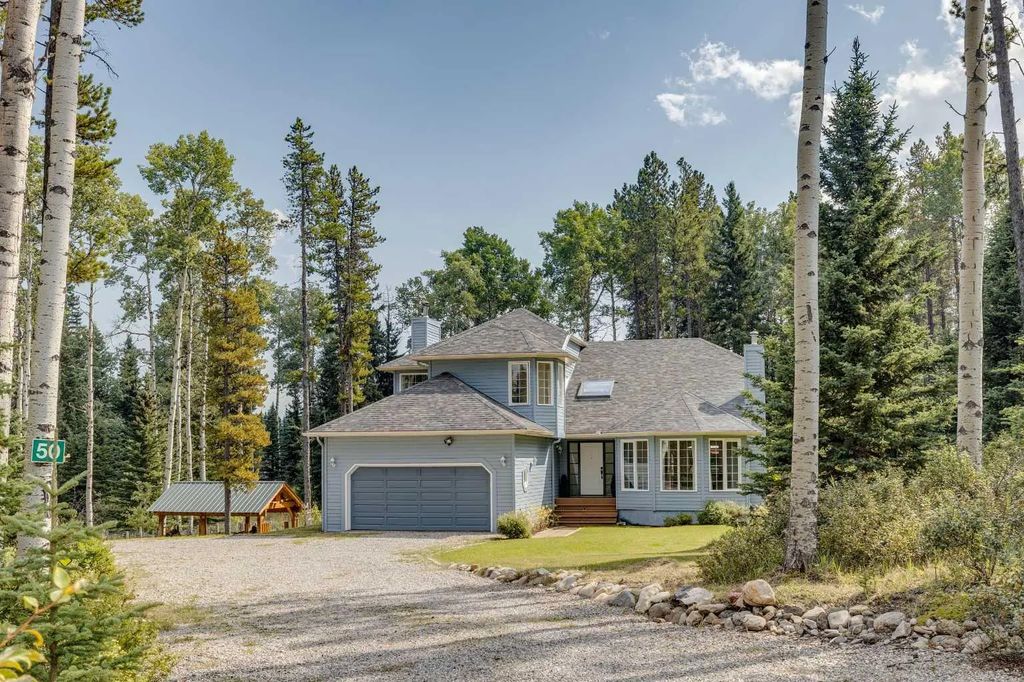
Houses, Condos, Acreages and Real Estate For sale.
Rockyview Market Snapshot
Bragg Creek had too few sales in September 2026 for community-level statistics, so this snapshot shows Rockyview, the area it belongs to.
September 2026 · all residential property types
Benchmark price
$784,100
▲ 4.8% vs September
Median price
$667,500
▲ 0.4% vs September
Average price
$895,770
▲ 9.6% vs September
Sold vs asking
97.0%
▼ 1.0 pts vs September
Homes sold
120
▲ 6% vs September
New listings
318
▲ 23% vs September
Active listings
704
▲ 7% vs September
Months of supply
5.9
▲ 0.1 vs September
Days on market
66
▲ 22 days vs September
September 2026September last year
In September 2026, the benchmark price for Rockyview was $784,100, up 4.8% from September last year. 120 homes sold (up 6%), 318 new listings came on the market (up 23%), and there were 704 active listings at month end (up 7%). Among homes that sold, the median sale price was $667,500 (up 0.4%) and the average sale price was $895,770 (up 9.6%), and homes sold for 97.0% of their asking price. That is 5.9 months of supply, and homes spent 66 days on the market (up 22 days). Figures cover all residential property types.
View the numbers
Measure
September 2026
September last year
Benchmark price
$784,100
$748,000
Median price
$667,500
$665,000
Average price
$895,770
$817,407
Sold vs asking
97.0%
98.0%
Homes sold
120
113
New listings
318
258
Active listings
704
656
Months of supply
5.9
5.8
Days on market
66
44
12-month trend
Benchmark price
$784,100
Oct 2025Sep 2026
Up 4.4% since Oct 2025
Median price
$667,500
Oct 2025Sep 2026
Down 3.5% since Oct 2025
Homes sold
120
Oct 2025Sep 2026
Range 79 to 196
Active listings
704
Oct 2025Sep 2026
Range 392 to 704
Months of supply
5.9
Oct 2025Sep 2026
Range 3.0 to 5.9
Sold vs asking
97.0%
Oct 2025Sep 2026
Range 97.0% to 99.0%
Last 12 monthsSame months a year earlier (dashed)
View the monthly numbers
Month
Benchmark price
Sold
New listings
Active listings
Months of supply
Days on market
Median price
Average price
Sold vs asking
Oct 2025
$751,200
141
244
617
4.4
55
$692,000
$1,027,168
98.0%
Nov 2025
$739,600
122
209
578
4.7
65
$673,730
$879,654
97.0%
Dec 2025
$768,100
79
89
392
5.0
51
$635,000
$873,922
97.0%
Jan 2026
$767,500
93
250
476
5.1
67
$610,000
$756,263
98.0%
Feb 2026
$776,100
148
271
527
3.6
56
$637,500
$830,039
98.0%
Mar 2026
$771,200
157
290
556
3.5
42
$647,500
$798,291
98.0%
Apr 2026
$778,200
196
314
595
3.0
52
$685,388
$847,764
98.0%
May 2026
$794,800
183
355
661
3.6
45
$739,900
$902,336
99.0%
Jun 2026
$810,300
182
296
653
3.6
46
$709,323
$885,213
98.0%
Jul 2026
$797,600
153
294
669
4.4
48
$685,000
$854,546
97.0%
Aug 2026
$785,200
152
267
630
4.1
50
$650,000
$838,976
98.0%
Sep 2026
$784,100
120
318
704
5.9
66
$667,500
$895,770
97.0%
September 2026 · detached homes
Benchmark price
$883,900
▲ 2.8% vs September
Median price
$777,500
▼ 2.2% vs September
Average price
$1,059,629
▲ 7.9% vs September
Sold vs asking
97.0%
▼ 1.0 pts vs September
Homes sold
86
▲ 12% vs September
New listings
230
▲ 31% vs September
Active listings
490
▼ 1% vs September
Months of supply
5.7
▼ 0.7 vs September
Days on market
69
▲ 21 days vs September
September 2026September last year
In September 2026, the benchmark price for Rockyview was $883,900, up 2.8% from September last year. 86 homes sold (up 12%), 230 new listings came on the market (up 31%), and there were 490 active listings at month end (down 1%). Among homes that sold, the median sale price was $777,500 (down 2.2%) and the average sale price was $1,059,629 (up 7.9%), and homes sold for 97.0% of their asking price. That is 5.7 months of supply, and homes spent 69 days on the market (up 21 days). Figures cover detached homes.
View the numbers
Measure
September 2026
September last year
Benchmark price
$883,900
$860,000
Median price
$777,500
$795,000
Average price
$1,059,629
$982,229
Sold vs asking
97.0%
98.0%
Homes sold
86
77
New listings
230
175
Active listings
490
494
Months of supply
5.7
6.4
Days on market
69
48
12-month trend
Benchmark price
$883,900
Oct 2025Sep 2026
Up 2.4% since Oct 2025
Median price
$777,500
Oct 2025Sep 2026
Down 7.3% since Oct 2025
Homes sold
86
Oct 2025Sep 2026
Range 59 to 136
Active listings
490
Oct 2025Sep 2026
Range 266 to 490
Months of supply
5.7
Oct 2025Sep 2026
Range 3.0 to 5.7
Sold vs asking
97.0%
Oct 2025Sep 2026
Range 97.0% to 99.0%
Last 12 monthsSame months a year earlier (dashed)
View the monthly numbers
Month
Benchmark price
Sold
New listings
Active listings
Months of supply
Days on market
Median price
Average price
Sold vs asking
Oct 2025
$863,400
100
168
454
4.5
57
$839,100
$1,251,666
97.0%
Nov 2025
$849,900
94
157
420
4.5
64
$718,888
$992,224
97.0%
Dec 2025
$870,700
59
57
266
4.5
53
$855,000
$1,022,631
97.0%
Jan 2026
$874,000
60
154
320
5.3
76
$761,750
$921,604
98.0%
Feb 2026
$883,200
98
182
357
3.6
63
$699,360
$991,640
97.0%
Mar 2026
$874,800
108
192
368
3.4
42
$739,500
$918,243
98.0%
Apr 2026
$884,800
133
218
395
3.0
54
$780,000
$1,010,864
98.0%
May 2026
$901,500
129
245
441
3.4
44
$850,000
$1,076,152
99.0%
Jun 2026
$921,900
136
209
440
3.2
42
$778,500
$1,007,436
98.0%
Jul 2026
$906,000
105
200
457
4.4
48
$850,000
$1,034,983
97.0%
Aug 2026
$887,200
96
174
429
4.5
48
$762,500
$1,008,660
98.0%
Sep 2026
$883,900
86
230
490
5.7
69
$777,500
$1,059,629
97.0%
September 2026 · semi-detached homes
Benchmark price
$561,900
▲ 6.9% vs September
Median price
$501,900
▼ 3.1% vs September
Average price
$579,286
▲ 7.6% vs September
Sold vs asking
98.0%
▼ 1.0 pts vs September
Homes sold
15
▼ 21% vs September
New listings
44
▲ 19% vs September
Active listings
102
▲ 48% vs September
Months of supply
6.8
▲ 3.2 vs September
Days on market
66
▲ 29 days vs September
September 2026September last year
In September 2026, the benchmark price for Rockyview was $561,900, up 6.9% from September last year. 15 homes sold (down 21%), 44 new listings came on the market (up 19%), and there were 102 active listings at month end (up 48%). Among homes that sold, the median sale price was $501,900 (down 3.1%) and the average sale price was $579,286 (up 7.6%), and homes sold for 98.0% of their asking price. That is 6.8 months of supply, and homes spent 66 days on the market (up 29 days). Figures cover semi-detached homes.
View the numbers
Measure
September 2026
September last year
Benchmark price
$561,900
$525,700
Median price
$501,900
$517,700
Average price
$579,286
$538,389
Sold vs asking
98.0%
99.0%
Homes sold
15
19
New listings
44
37
Active listings
102
69
Months of supply
6.8
3.6
Days on market
66
37
12-month trend
Benchmark price
$561,900
Oct 2025Sep 2026
Up 6.8% since Oct 2025
Median price
$501,900
Oct 2025Sep 2026
Up 5.7% since Oct 2025
Homes sold
15
Oct 2025Sep 2026
Range 11 to 34
Active listings
102
Oct 2025Sep 2026
Range 58 to 108
Months of supply
6.8
Oct 2025Sep 2026
Range 2.7 to 6.8
Sold vs asking
98.0%
Oct 2025Sep 2026
Range 98.0% to 99.0%
Last 12 monthsSame months a year earlier (dashed)
View the monthly numbers
Month
Benchmark price
Sold
New listings
Active listings
Months of supply
Days on market
Median price
Average price
Sold vs asking
Oct 2025
$525,900
19
40
81
4.3
53
$474,683
$530,394
98.0%
Nov 2025
$515,700
13
22
78
6.0
56
$520,000
$623,008
99.0%
Dec 2025
$510,600
11
19
58
5.3
37
$528,000
$527,164
99.0%
Jan 2026
$500,400
18
49
71
3.9
62
$498,750
$514,006
98.0%
Feb 2026
$566,000
28
51
82
2.9
36
$543,500
$587,614
98.0%
Mar 2026
$564,700
33
48
89
2.7
38
$544,900
$590,417
99.0%
Apr 2026
$565,200
34
44
90
2.7
44
$521,700
$556,962
99.0%
May 2026
$574,400
23
53
108
4.7
43
$505,000
$601,802
99.0%
Jun 2026
$578,200
31
38
82
2.7
54
$494,000
$528,743
99.0%
Jul 2026
$570,100
23
48
92
4.0
47
$507,500
$526,870
98.0%
Aug 2026
$563,900
32
44
87
2.7
40
$500,000
$630,148
99.0%
Sep 2026
$561,900
15
44
102
6.8
66
$501,900
$579,286
98.0%
September 2026 · row and townhouse homes
Benchmark price
$454,400
▲ 2.7% vs September
Median price
$450,000
▲ 7.8% vs September
Average price
$457,311
▲ 7.7% vs September
Sold vs asking
98.0%
▲ 1.0 pts vs September
Homes sold
13
▲ 8% vs September
New listings
30
▼ 19% vs September
Active listings
89
▲ 19% vs September
Months of supply
6.9
▲ 0.6 vs September
Days on market
63
▲ 31 days vs September
September 2026September last year
In September 2026, the benchmark price for Rockyview was $454,400, up 2.7% from September last year. 13 homes sold (up 8%), 30 new listings came on the market (down 19%), and there were 89 active listings at month end (up 19%). Among homes that sold, the median sale price was $450,000 (up 7.8%) and the average sale price was $457,311 (up 7.7%), and homes sold for 98.0% of their asking price. That is 6.9 months of supply, and homes spent 63 days on the market (up 31 days). Figures cover row and townhouse homes.
View the numbers
Measure
September 2026
September last year
Benchmark price
$454,400
$442,500
Median price
$450,000
$417,500
Average price
$457,311
$424,618
Sold vs asking
98.0%
97.0%
Homes sold
13
12
New listings
30
37
Active listings
89
75
Months of supply
6.9
6.3
Days on market
63
32
12-month trend
Benchmark price
$454,400
Oct 2025Sep 2026
Up 4.0% since Oct 2025
Median price
$450,000
Oct 2025Sep 2026
Down 3.2% since Oct 2025
Homes sold
13
Oct 2025Sep 2026
Range 5 to 23
Active listings
89
Oct 2025Sep 2026
Range 59 to 103
Months of supply
6.9
Oct 2025Sep 2026
Range 3.7 to 11.8
Sold vs asking
98.0%
Oct 2025Sep 2026
Range 97.0% to 99.0%
Last 12 monthsSame months a year earlier (dashed)
View the monthly numbers
Month
Benchmark price
Sold
New listings
Active listings
Months of supply
Days on market
Median price
Average price
Sold vs asking
Oct 2025
$437,000
17
27
64
3.8
52
$464,900
$460,651
99.0%
Nov 2025
$431,900
10
25
65
6.5
79
$392,500
$460,459
97.0%
Dec 2025
$447,300
5
11
59
11.8
55
$362,500
$379,260
98.0%
Jan 2026
$436,600
9
32
70
7.8
46
$444,900
$439,906
98.0%
Feb 2026
$447,100
18
31
71
3.9
46
$392,500
$433,550
98.0%
Mar 2026
$444,600
13
39
77
5.9
56
$449,500
$430,974
98.0%
Apr 2026
$446,000
20
38
85
4.3
60
$449,700
$480,411
98.0%
May 2026
$450,300
23
42
84
3.7
54
$425,000
$437,098
99.0%
Jun 2026
$453,700
12
42
103
8.6
67
$516,500
$536,875
98.0%
Jul 2026
$450,700
18
31
94
5.2
59
$412,250
$436,739
98.0%
Aug 2026
$452,000
17
39
94
5.5
78
$452,381
$470,781
97.0%
Sep 2026
$454,400
13
30
89
6.9
63
$450,000
$457,311
98.0%
September 2026 · apartment condos
Benchmark price
$348,500
▲ 12.7% vs September
Median price
$295,000
▲ 3.5% vs September
Average price
$288,333
▲ 2.2% vs September
Sold vs asking
97.0%
▬ No change vs September
Homes sold
6
▲ 20% vs September
New listings
14
▲ 56% vs September
Active listings
23
▲ 28% vs September
Months of supply
3.8
▲ 0.2 vs September
Days on market
39
▼ 9 days vs September
September 2026September last year
In September 2026, the benchmark price for Rockyview was $348,500, up 12.7% from September last year. 6 homes sold (up 20%), 14 new listings came on the market (up 56%), and there were 23 active listings at month end (up 28%). Among homes that sold, the median sale price was $295,000 (up 3.5%) and the average sale price was $288,333 (up 2.2%), and homes sold for 97.0% of their asking price. That is 3.8 months of supply, and homes spent 39 days on the market (down 9 days). Figures cover apartment condos.
View the numbers
Measure
September 2026
September last year
Benchmark price
$348,500
$309,100
Median price
$295,000
$285,000
Average price
$288,333
$282,100
Sold vs asking
97.0%
97.0%
Homes sold
6
5
New listings
14
9
Active listings
23
18
Months of supply
3.8
3.6
Days on market
39
48
12-month trend
Benchmark price
$348,500
Oct 2025Sep 2026
Up 12.5% since Oct 2025
Median price
$295,000
Oct 2025Sep 2026
Down 3.3% since Oct 2025
Homes sold
6
Oct 2025Sep 2026
Range 3 to 9
Active listings
23
Oct 2025Sep 2026
Range 9 to 28
Months of supply
3.8
Oct 2025Sep 2026
Range 2.3 to 9.3
Sold vs asking
97.0%
Oct 2025Sep 2026
Range 93.0% to 98.0%
Last 12 monthsSame months a year earlier (dashed)
View the monthly numbers
Month
Benchmark price
Sold
New listings
Active listings
Months of supply
Days on market
Median price
Average price
Sold vs asking
Oct 2025
$309,900
5
9
18
3.6
22
$305,000
$351,100
97.0%
Nov 2025
$304,500
5
5
15
3.0
73
$290,000
$269,000
97.0%
Dec 2025
$329,900
4
2
9
2.3
57
$259,750
$252,375
93.0%
Jan 2026
$332,500
6
15
15
2.5
24
$259,500
$304,167
98.0%
Feb 2026
$324,800
4
7
17
4.3
41
$346,500
$352,000
98.0%
Mar 2026
$339,400
3
11
22
7.3
42
$354,500
$358,333
97.0%
Apr 2026
$342,400
9
14
25
2.8
43
$315,000
$352,444
97.0%
May 2026
$357,000
8
15
28
3.5
35
$288,250
$301,162
98.0%
Jun 2026
$351,900
3
7
28
9.3
55
$400,000
$421,333
98.0%
Jul 2026
$354,600
7
15
26
3.7
26
$300,000
$299,000
98.0%
Aug 2026
$344,600
7
10
20
2.9
59
$365,000
$360,714
96.0%
Sep 2026
$348,500
6
14
23
3.8
39
$295,000
$288,333
97.0%
Source: Calgary Real Estate Board (CREB®) monthly statistics. Benchmark price is the typical price of a home in the area. Median and average prices are for homes that sold in the month. Figures can be revised.
Search Bragg Creek Houses, Land, Acreages and MLS® Listings For sale.