
Greenwood/Greenbriar NW Calgary MLS® Listings
Houses, Condos and Real Estate For Sale by Calgary REALTORS®.
Northwest Calgary Market Snapshot
Greenwood/Greenbriar had too few sales in September 2026 for community-level statistics, so this snapshot shows Northwest Calgary, the district it belongs to.
September 2026 · all residential property types
In September 2026, the benchmark price for Northwest Calgary was $627,000, down 0.2% from September last year. 187 homes sold (up 20%), 383 new listings came on the market (unchanged), and there were 670 active listings at month end (unchanged). Among homes that sold, the median sale price was $695,000 (up 4.4%) and the average sale price was $706,925 (up 8.2%), and homes sold for 97.0% of their asking price. That is 3.6 months of supply, and homes spent 44 days on the market (up 5 days). Figures cover all residential property types.
View the numbers
| Measure | September 2026 | September last year |
|---|---|---|
| Benchmark price | $627,000 | $628,000 |
| Median price | $695,000 | $666,000 |
| Average price | $706,925 | $653,305 |
| Sold vs asking | 97.0% | 98.0% |
| Homes sold | 187 | 156 |
| New listings | 383 | 384 |
| Active listings | 670 | 671 |
| Months of supply | 3.6 | 4.3 |
| Days on market | 44 | 39 |
12-month trend
View the monthly numbers
| Month | Benchmark price | Sold | New listings | Active listings | Months of supply | Days on market | Median price | Average price | Sold vs asking |
|---|---|---|---|---|---|---|---|---|---|
| Oct 2025 | $626,300 | 204 | 310 | 603 | 3.0 | 37 | $678,750 | $673,161 | 97.0% |
| Nov 2025 | $614,200 | 169 | 196 | 488 | 2.9 | 45 | $610,000 | $647,433 | 97.0% |
| Dec 2025 | $615,000 | 121 | 106 | 338 | 2.8 | 53 | $679,000 | $685,744 | 97.0% |
| Jan 2026 | $603,700 | 133 | 238 | 362 | 2.7 | 50 | $657,000 | $648,047 | 98.0% |
| Feb 2026 | $618,100 | 135 | 251 | 419 | 3.1 | 34 | $665,000 | $661,565 | 98.0% |
| Mar 2026 | $622,600 | 176 | 319 | 492 | 2.8 | 32 | $681,715 | $700,679 | 98.0% |
| Apr 2026 | $633,100 | 253 | 397 | 533 | 2.1 | 30 | $675,000 | $705,464 | 99.0% |
| May 2026 | $636,900 | 256 | 496 | 689 | 2.7 | 31 | $684,250 | $713,930 | 99.0% |
| Jun 2026 | $633,500 | 271 | 443 | 714 | 2.6 | 32 | $699,200 | $720,407 | 98.0% |
| Jul 2026 | $621,000 | 225 | 380 | 704 | 3.1 | 35 | $635,000 | $661,402 | 98.0% |
| Aug 2026 | $627,400 | 207 | 319 | 657 | 3.2 | 38 | $661,888 | $669,209 | 98.0% |
| Sep 2026 | $627,000 | 187 | 383 | 670 | 3.6 | 44 | $695,000 | $706,925 | 97.0% |
September 2026 · detached homes
In September 2026, the benchmark price for Northwest Calgary was $781,400, down 0.7% from September last year. 123 homes sold (up 43%), 231 new listings came on the market (up 3%), and there were 352 active listings at month end (up 3%). Among homes that sold, the median sale price was $762,500 (down 0.5%) and the average sale price was $852,406 (up 3.1%), and homes sold for 98.0% of their asking price. That is 2.9 months of supply, and homes spent 36 days on the market (down 0 days). Figures cover detached homes.
View the numbers
| Measure | September 2026 | September last year |
|---|---|---|
| Benchmark price | $781,400 | $786,600 |
| Median price | $762,500 | $766,500 |
| Average price | $852,406 | $827,167 |
| Sold vs asking | 98.0% | 98.0% |
| Homes sold | 123 | 86 |
| New listings | 231 | 225 |
| Active listings | 352 | 343 |
| Months of supply | 2.9 | 4.0 |
| Days on market | 36 | 36 |
12-month trend
View the monthly numbers
| Month | Benchmark price | Sold | New listings | Active listings | Months of supply | Days on market | Median price | Average price | Sold vs asking |
|---|---|---|---|---|---|---|---|---|---|
| Oct 2025 | $785,400 | 118 | 169 | 306 | 2.6 | 35 | $765,000 | $822,854 | 97.0% |
| Nov 2025 | $768,200 | 103 | 100 | 237 | 2.3 | 40 | $710,000 | $776,536 | 97.0% |
| Dec 2025 | $769,600 | 79 | 51 | 124 | 1.6 | 52 | $725,000 | $781,717 | 97.0% |
| Jan 2026 | $755,100 | 79 | 128 | 143 | 1.8 | 46 | $705,000 | $789,254 | 98.0% |
| Feb 2026 | $774,600 | 80 | 128 | 166 | 2.1 | 27 | $732,500 | $804,620 | 98.0% |
| Mar 2026 | $780,000 | 111 | 174 | 201 | 1.8 | 28 | $778,000 | $869,059 | 99.0% |
| Apr 2026 | $795,500 | 153 | 230 | 237 | 1.6 | 23 | $775,000 | $853,655 | 99.0% |
| May 2026 | $799,000 | 160 | 283 | 322 | 2.0 | 24 | $781,250 | $853,829 | 99.0% |
| Jun 2026 | $791,500 | 168 | 269 | 349 | 2.1 | 27 | $756,500 | $838,358 | 99.0% |
| Jul 2026 | $770,600 | 135 | 228 | 355 | 2.6 | 28 | $732,500 | $818,237 | 98.0% |
| Aug 2026 | $781,500 | 129 | 196 | 343 | 2.7 | 33 | $750,000 | $816,252 | 98.0% |
| Sep 2026 | $781,400 | 123 | 231 | 352 | 2.9 | 36 | $762,500 | $852,406 | 98.0% |
September 2026 · semi-detached homes
In September 2026, the benchmark price for Northwest Calgary was $680,000, up 1.3% from September last year. 16 homes sold (up 33%), 34 new listings came on the market (unchanged), and there were 50 active listings at month end (down 12%). Among homes that sold, the median sale price was $626,000 (up 19.4%) and the average sale price was $661,618 (up 7.1%), and homes sold for 96.0% of their asking price. That is 3.1 months of supply, and homes spent 56 days on the market (up 24 days). Figures cover semi-detached homes.
View the numbers
| Measure | September 2026 | September last year |
|---|---|---|
| Benchmark price | $680,000 | $671,100 |
| Median price | $626,000 | $524,500 |
| Average price | $661,618 | $617,796 |
| Sold vs asking | 96.0% | 98.0% |
| Homes sold | 16 | 12 |
| New listings | 34 | 34 |
| Active listings | 50 | 57 |
| Months of supply | 3.1 | 4.8 |
| Days on market | 56 | 32 |
12-month trend
View the monthly numbers
| Month | Benchmark price | Sold | New listings | Active listings | Months of supply | Days on market | Median price | Average price | Sold vs asking |
|---|---|---|---|---|---|---|---|---|---|
| Oct 2025 | $671,000 | 26 | 31 | 48 | 1.9 | 33 | $645,000 | $700,580 | 99.0% |
| Nov 2025 | $652,200 | 13 | 19 | 45 | 3.5 | 58 | $562,000 | $624,115 | 98.0% |
| Dec 2025 | $647,700 | 10 | 6 | 33 | 3.3 | 64 | $755,500 | $784,190 | 98.0% |
| Jan 2026 | $651,300 | 13 | 26 | 35 | 2.7 | 36 | $750,000 | $747,024 | 98.0% |
| Feb 2026 | $667,800 | 14 | 26 | 39 | 2.8 | 39 | $630,000 | $652,929 | 99.0% |
| Mar 2026 | $683,700 | 9 | 26 | 53 | 5.9 | 19 | $650,500 | $716,139 | 99.0% |
| Apr 2026 | $688,300 | 20 | 35 | 60 | 3.0 | 37 | $670,250 | $691,458 | 98.0% |
| May 2026 | $692,300 | 24 | 43 | 65 | 2.7 | 39 | $642,500 | $668,758 | 100.0% |
| Jun 2026 | $699,400 | 31 | 38 | 61 | 2.0 | 40 | $765,000 | $748,165 | 99.0% |
| Jul 2026 | $681,700 | 18 | 31 | 60 | 3.3 | 35 | $573,000 | $638,833 | 98.0% |
| Aug 2026 | $680,600 | 15 | 24 | 53 | 3.5 | 29 | $625,000 | $647,380 | 98.0% |
| Sep 2026 | $680,000 | 16 | 34 | 50 | 3.1 | 56 | $626,000 | $661,618 | 96.0% |
September 2026 · row and townhouse homes
In September 2026, the benchmark price for Northwest Calgary was $434,000, down 2.0% from September last year. 18 homes sold (down 40%), 55 new listings came on the market (unchanged), and there were 118 active listings at month end (up 16%). Among homes that sold, the median sale price was $375,250 (down 9.1%) and the average sale price was $387,997 (down 20.3%), and homes sold for 97.0% of their asking price. That is 6.6 months of supply, and homes spent 69 days on the market (up 26 days). Figures cover row and townhouse homes.
View the numbers
| Measure | September 2026 | September last year |
|---|---|---|
| Benchmark price | $434,000 | $442,900 |
| Median price | $375,250 | $413,000 |
| Average price | $387,997 | $486,590 |
| Sold vs asking | 97.0% | 98.0% |
| Homes sold | 18 | 30 |
| New listings | 55 | 55 |
| Active listings | 118 | 102 |
| Months of supply | 6.6 | 3.4 |
| Days on market | 69 | 43 |
12-month trend
View the monthly numbers
| Month | Benchmark price | Sold | New listings | Active listings | Months of supply | Days on market | Median price | Average price | Sold vs asking |
|---|---|---|---|---|---|---|---|---|---|
| Oct 2025 | $433,000 | 23 | 48 | 97 | 4.2 | 46 | $455,000 | $450,196 | 98.0% |
| Nov 2025 | $429,100 | 32 | 32 | 70 | 2.2 | 44 | $443,250 | $449,583 | 97.0% |
| Dec 2025 | $428,000 | 13 | 15 | 58 | 4.5 | 47 | $415,000 | $431,188 | 97.0% |
| Jan 2026 | $423,800 | 10 | 27 | 63 | 6.3 | 48 | $446,750 | $472,618 | 97.0% |
| Feb 2026 | $430,400 | 18 | 49 | 88 | 4.9 | 45 | $465,125 | $464,019 | 99.0% |
| Mar 2026 | $431,500 | 23 | 46 | 89 | 3.9 | 28 | $399,000 | $421,269 | 98.0% |
| Apr 2026 | $427,700 | 43 | 61 | 86 | 2.0 | 32 | $450,000 | $501,367 | 99.0% |
| May 2026 | $430,100 | 33 | 81 | 121 | 3.7 | 38 | $434,900 | $480,854 | 98.0% |
| Jun 2026 | $437,100 | 31 | 60 | 127 | 4.1 | 28 | $472,500 | $499,484 | 98.0% |
| Jul 2026 | $436,900 | 31 | 50 | 117 | 3.8 | 40 | $403,200 | $456,124 | 99.0% |
| Aug 2026 | $436,800 | 29 | 42 | 105 | 3.6 | 42 | $410,000 | $449,085 | 99.0% |
| Sep 2026 | $434,000 | 18 | 55 | 118 | 6.6 | 69 | $375,250 | $387,997 | 97.0% |
September 2026 · apartment condos
In September 2026, the benchmark price for Northwest Calgary was $274,900, down 8.0% from September last year. 30 homes sold (up 7%), 63 new listings came on the market (down 10%), and there were 150 active listings at month end (down 11%). Among homes that sold, the median sale price was $297,500 (down 6.7%) and the average sale price was $325,972 (up 4.1%), and homes sold for 96.0% of their asking price. That is 5.0 months of supply, and homes spent 57 days on the market (up 12 days). Figures cover apartment condos.
View the numbers
| Measure | September 2026 | September last year |
|---|---|---|
| Benchmark price | $274,900 | $298,700 |
| Median price | $297,500 | $319,000 |
| Average price | $325,972 | $313,139 |
| Sold vs asking | 96.0% | 97.0% |
| Homes sold | 30 | 28 |
| New listings | 63 | 70 |
| Active listings | 150 | 169 |
| Months of supply | 5.0 | 6.0 |
| Days on market | 57 | 45 |
12-month trend
View the monthly numbers
| Month | Benchmark price | Sold | New listings | Active listings | Months of supply | Days on market | Median price | Average price | Sold vs asking |
|---|---|---|---|---|---|---|---|---|---|
| Oct 2025 | $300,500 | 37 | 62 | 152 | 4.1 | 42 | $310,000 | $315,092 | 96.0% |
| Nov 2025 | $296,400 | 21 | 45 | 136 | 6.5 | 58 | $312,999 | $330,133 | 97.0% |
| Dec 2025 | $299,500 | 19 | 34 | 123 | 6.5 | 57 | $310,000 | $409,053 | 97.0% |
| Jan 2026 | $286,800 | 31 | 57 | 121 | 3.9 | 65 | $287,500 | $303,279 | 96.0% |
| Feb 2026 | $289,000 | 23 | 48 | 126 | 5.5 | 46 | $299,500 | $323,843 | 98.0% |
| Mar 2026 | $288,600 | 33 | 73 | 149 | 4.5 | 51 | $280,000 | $324,834 | 97.0% |
| Apr 2026 | $294,600 | 37 | 71 | 150 | 4.1 | 54 | $302,500 | $337,436 | 97.0% |
| May 2026 | $300,600 | 39 | 89 | 181 | 4.6 | 49 | $310,000 | $365,001 | 97.0% |
| Jun 2026 | $295,100 | 41 | 76 | 177 | 4.3 | 48 | $316,000 | $383,151 | 97.0% |
| Jul 2026 | $291,700 | 41 | 71 | 172 | 4.2 | 56 | $284,000 | $310,115 | 96.0% |
| Aug 2026 | $283,300 | 34 | 57 | 156 | 4.6 | 56 | $282,500 | $308,693 | 96.0% |
| Sep 2026 | $274,900 | 30 | 63 | 150 | 5.0 | 57 | $297,500 | $325,972 | 96.0% |
Source: Calgary Real Estate Board (CREB®) monthly statistics. Benchmark price is the typical price of a home in the area. Median and average prices are for homes that sold in the month. Figures can be revised.
Sign Up for free
Get the first to receive the latest listing updates, save favorites & much more by signing up. Or already have in account,Sign in.
Greenwood/Greenbriar MLS® Listings - Houses, Condos and Real Estate For Sale in NW Calgary
- All Listings
- Under $100,000
- $100,000 - $200,000
- $200,000 - $300,000
- $300,000 - $400,000
- $400,000 - $500,000
- $500,000 - $600,000
- $600,000 - $700,000
- $700,000 - $800,000
- $900,000 - $1,000,000
- Over $1,000,000
About Greenwood/Greenbriar
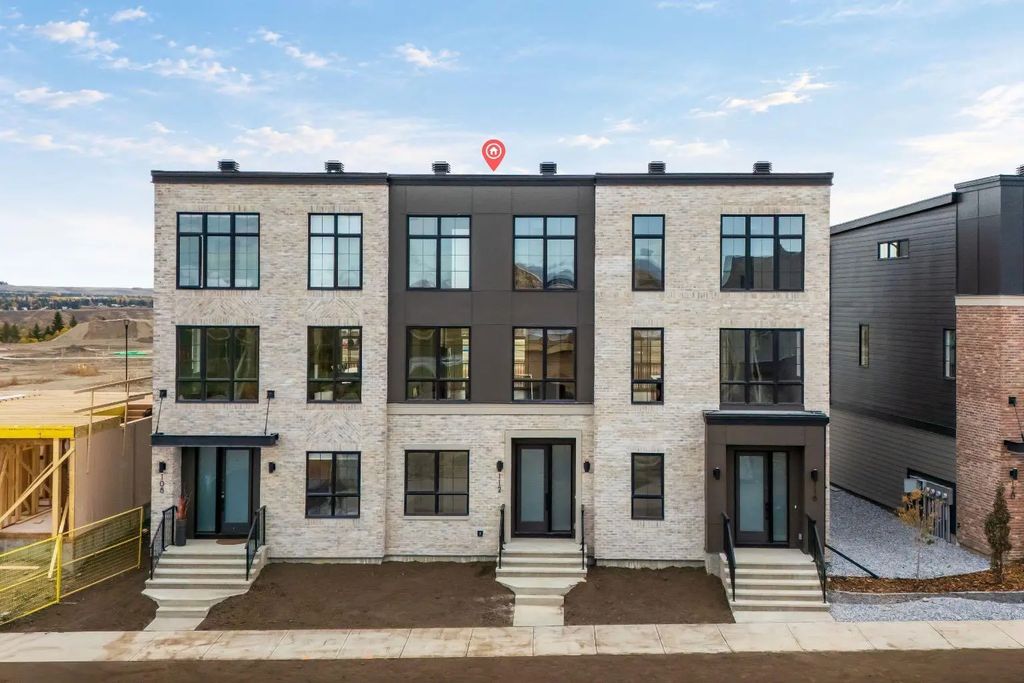
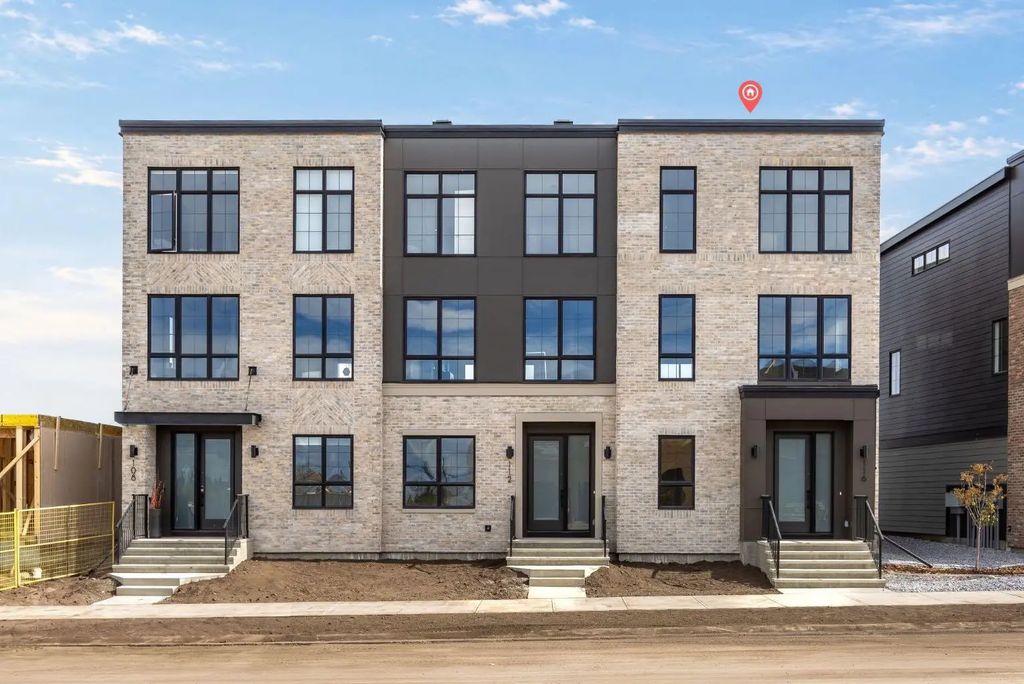
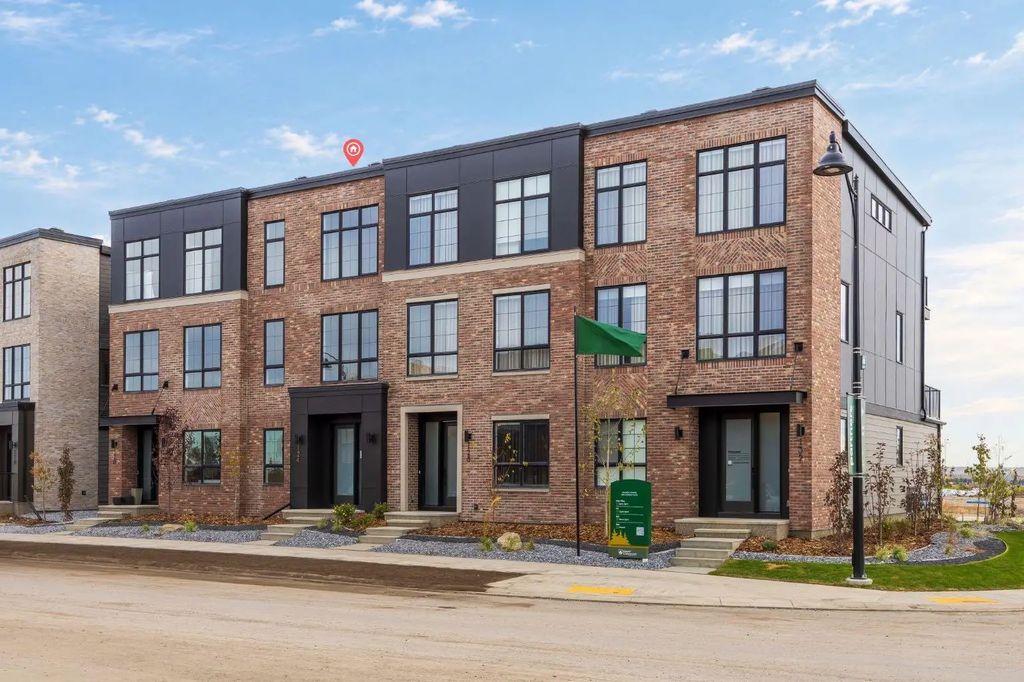
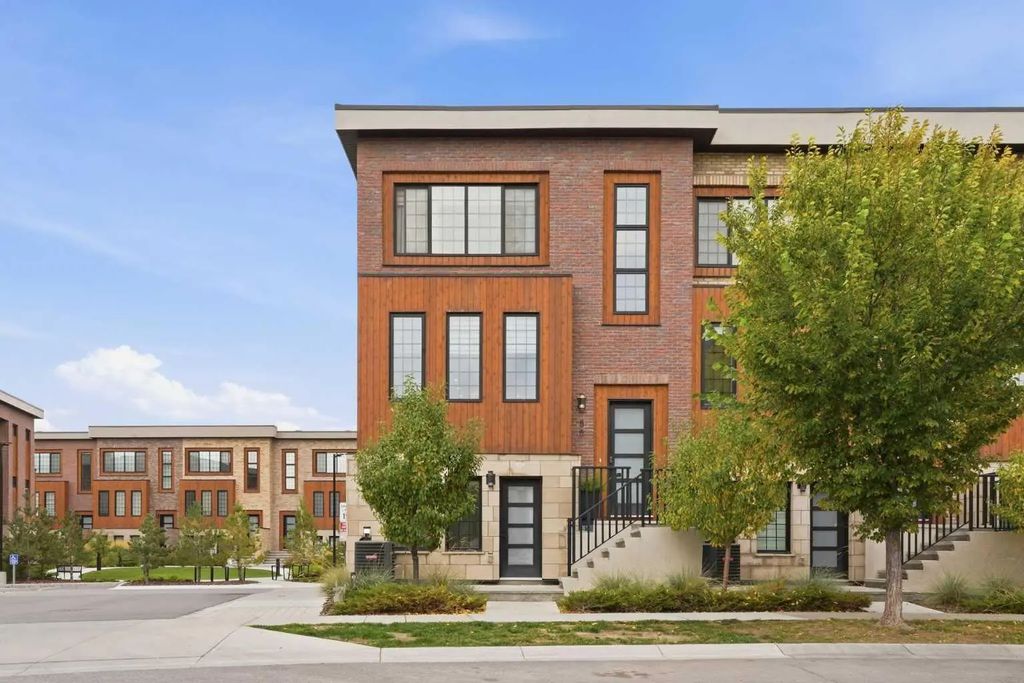
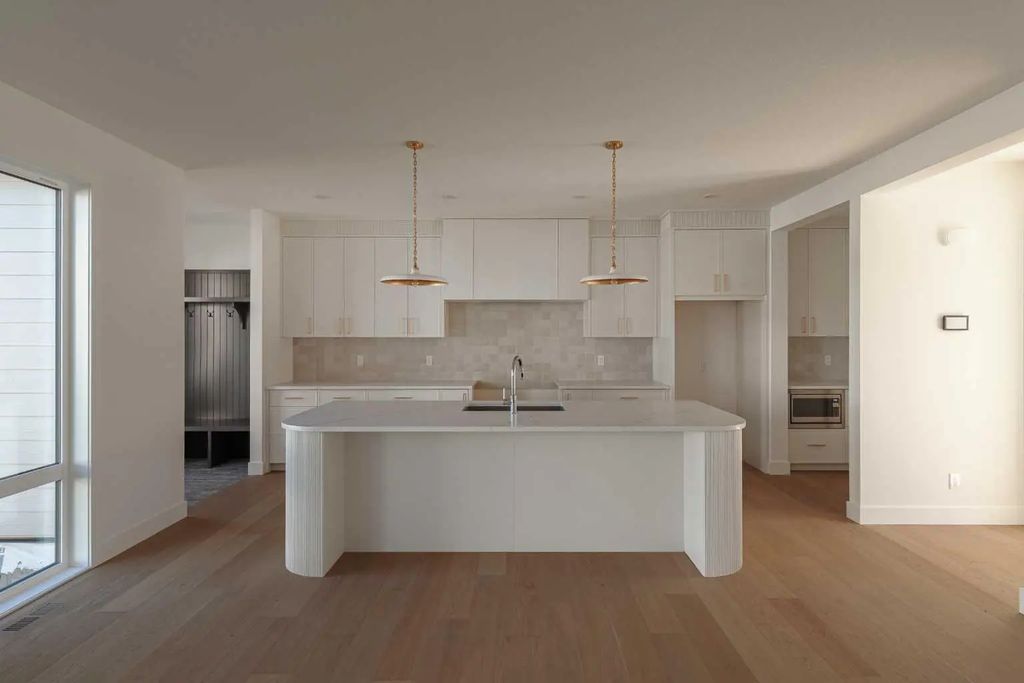
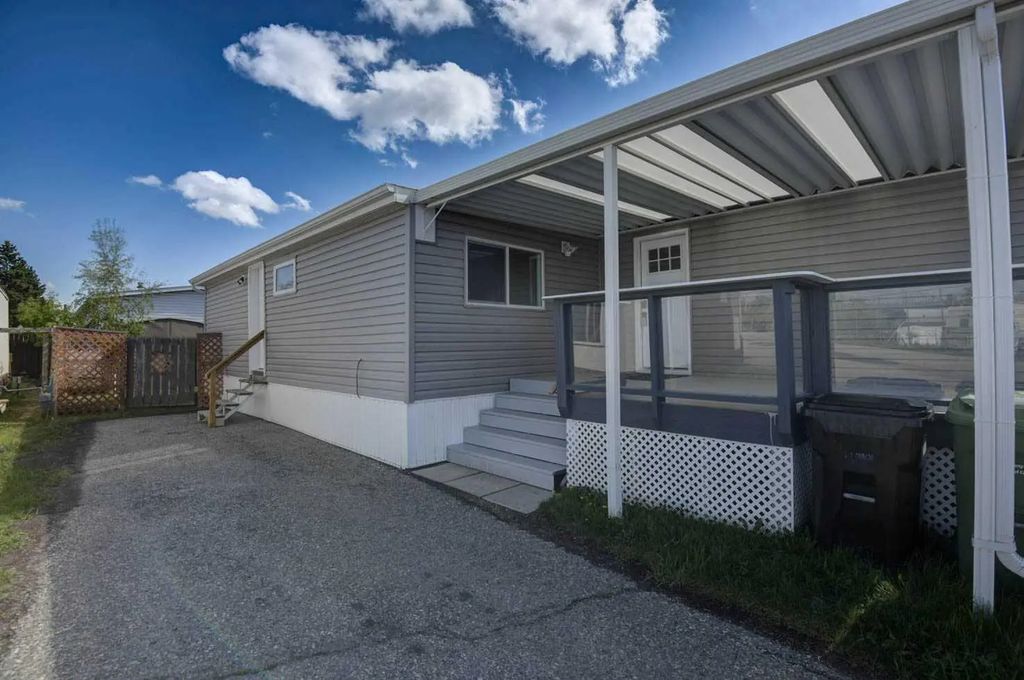
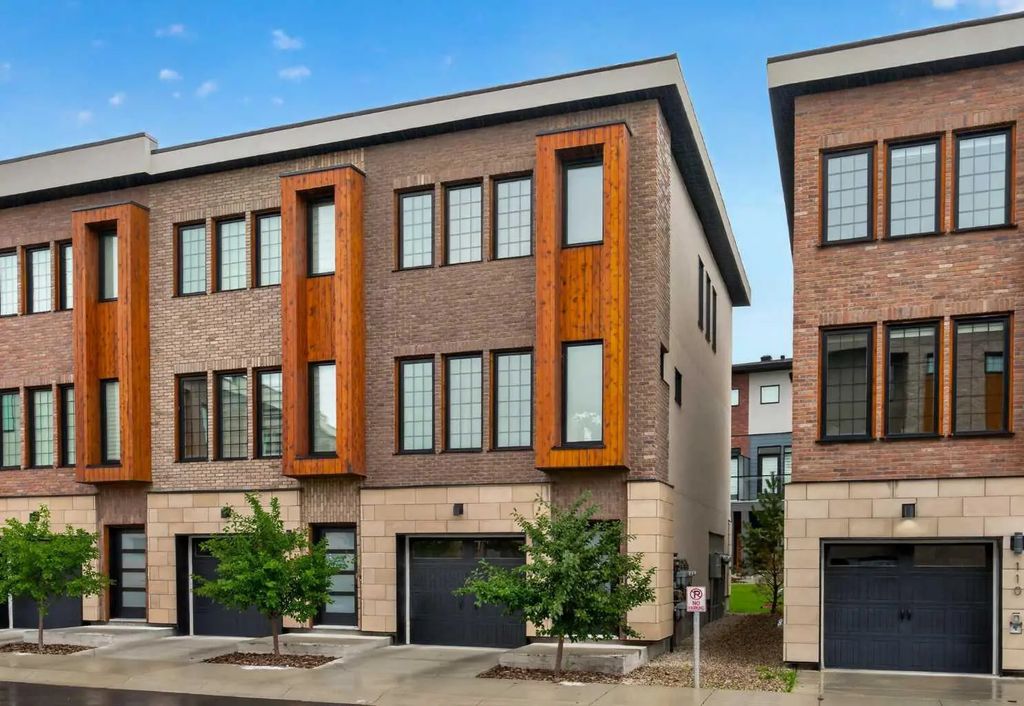
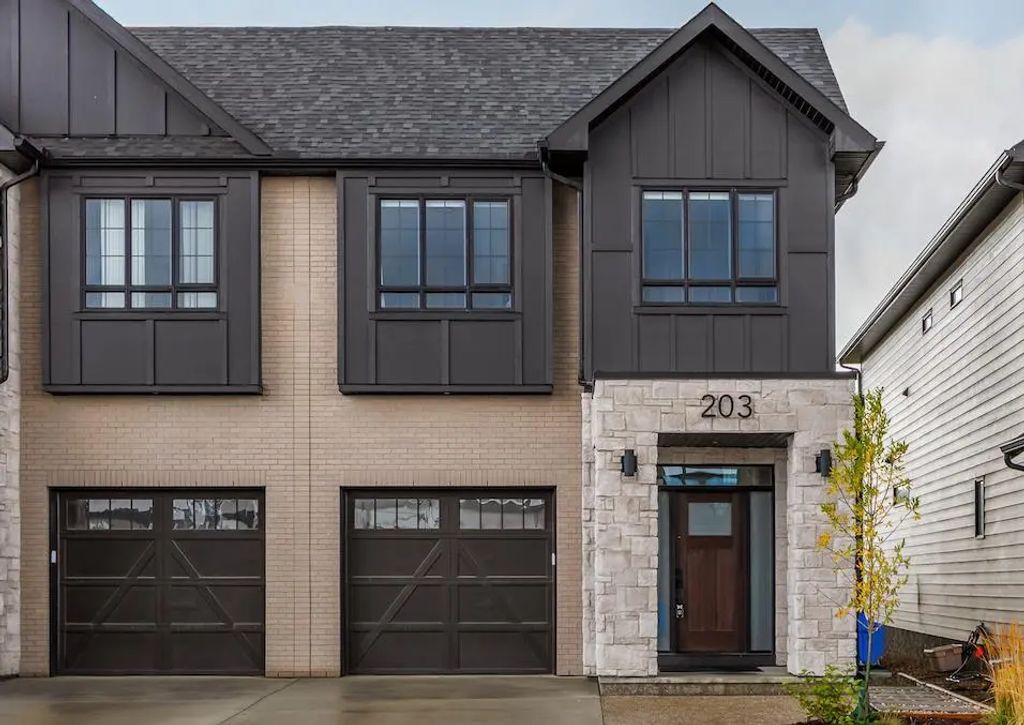
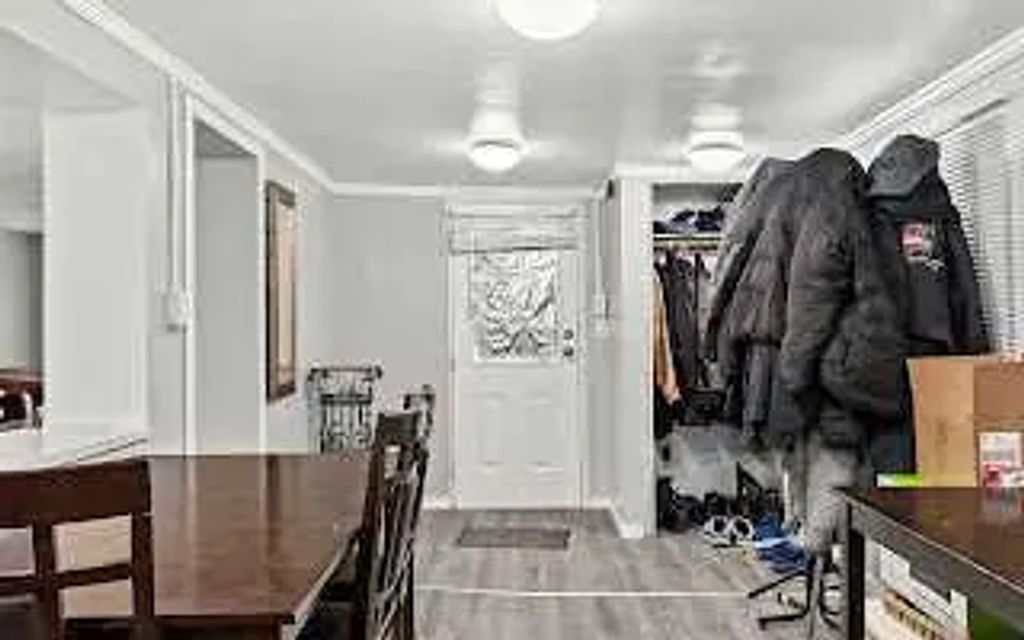
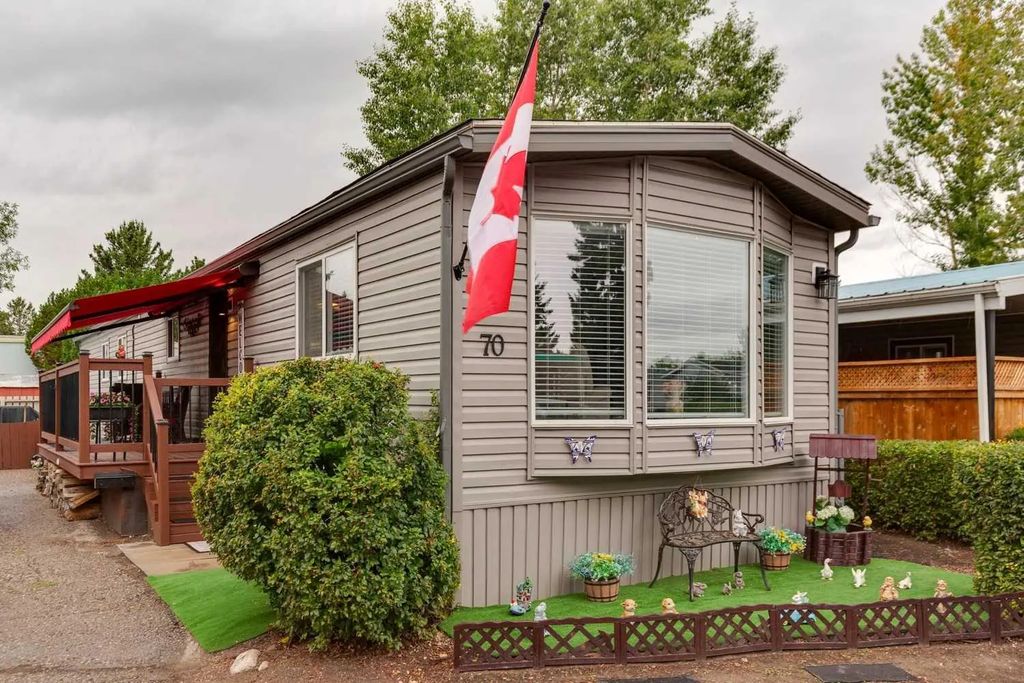
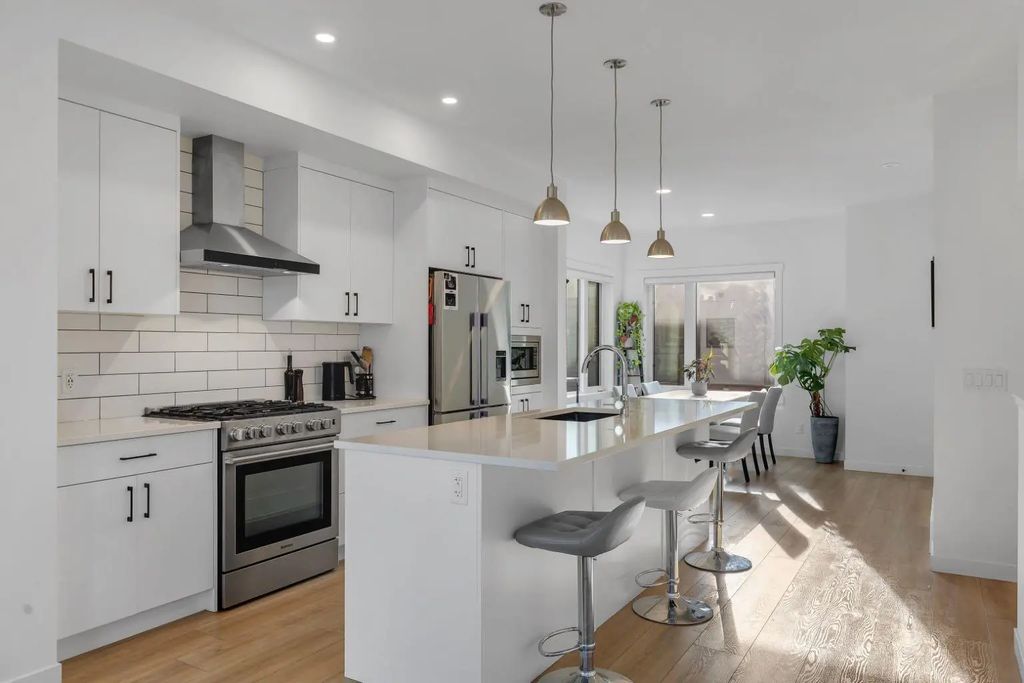
Greenwood/Greenbriar is an established community in northwest Calgary, tucked along the Bow River near Sarcee Trail and Old Banff Coach Road. Its riverside setting means many streets back onto green space and pathways, with the Greenbriar Community Association providing local programming and a neighbourhood rink. The area is primarily made up of single-family homes on larger, mature lots, with easy access to Bowness Park and quick routes into downtown or west toward the mountains.
Frequently Asked Questions
What kind of homes are in Greenwood/Greenbriar?
The community is made up mostly of single-family homes, many on larger, mature lots.
What’s nearby Greenwood/Greenbriar?
Bowness Park and the Bow River pathway system are just minutes away, along with quick access to Sarcee Trail and Stoney Trail.
Is Greenwood/Greenbriar a family-friendly community?
Yes — its quiet, riverside streets and active community association make it a popular choice for families.
Featured Neighbourhoods in NW Calgary
- Arbour Lake
- Bowness
- Brentwood
- Charleswood
- Citadel
- Collingwood
- Dalhousie
- Edgemont
- Greenwood/Greenbriar
- Hamptons
- Hanson Ranch
- Haskayne
- Hawkwood
- Lynx Ridge
- Montgomery
- Ranchlands
- Ranchlands Estates
- Rocky Ridge Ranch
- Royal Oak
- Scenic Acres
- Silver Springs
- Tuscany
- University District
- University Heights
- Varsity Acres
- Varsity Estates
- Varsity Village