
Keystone Hills North Calgary MLS® Listings
Houses, Condos and Real Estate For Sale by Calgary REALTORS®.
North Calgary Market Snapshot
Keystone Hills is part of North Calgary. CREB reports statistics for North Calgary, so this snapshot shows North Calgary.
September 2026 · all residential property types
In September 2026, the benchmark price for North Calgary was $523,000, down 3.3% from September last year. 236 homes sold (up 7%), 426 new listings came on the market (down 10%), and there were 839 active listings at month end (down 5%). Among homes that sold, the median sale price was $556,250 (down 0.7%) and the average sale price was $536,268 (down 3.1%), and homes sold for 97.0% of their asking price. That is 3.6 months of supply, and homes spent 46 days on the market (up 4 days). Figures cover all residential property types.
View the numbers
| Measure | September 2026 | September last year |
|---|---|---|
| Benchmark price | $523,000 | $541,000 |
| Median price | $556,250 | $560,000 |
| Average price | $536,268 | $553,468 |
| Sold vs asking | 97.0% | 98.0% |
| Homes sold | 236 | 221 |
| New listings | 426 | 475 |
| Active listings | 839 | 887 |
| Months of supply | 3.6 | 4.0 |
| Days on market | 46 | 42 |
12-month trend
View the monthly numbers
| Month | Benchmark price | Sold | New listings | Active listings | Months of supply | Days on market | Median price | Average price | Sold vs asking |
|---|---|---|---|---|---|---|---|---|---|
| Oct 2025 | $534,900 | 226 | 436 | 834 | 3.7 | 42 | $569,000 | $550,218 | 97.0% |
| Nov 2025 | $527,900 | 194 | 293 | 711 | 3.7 | 46 | $571,000 | $558,659 | 97.0% |
| Dec 2025 | $521,700 | 153 | 161 | 476 | 3.1 | 54 | $539,000 | $529,585 | 97.0% |
| Jan 2026 | $518,800 | 167 | 378 | 566 | 3.4 | 55 | $580,000 | $579,534 | 98.0% |
| Feb 2026 | $523,300 | 202 | 364 | 627 | 3.1 | 44 | $538,500 | $539,147 | 98.0% |
| Mar 2026 | $524,700 | 234 | 422 | 699 | 3.0 | 37 | $554,500 | $546,301 | 98.0% |
| Apr 2026 | $524,000 | 275 | 507 | 781 | 2.8 | 33 | $570,000 | $566,440 | 98.0% |
| May 2026 | $526,500 | 252 | 529 | 878 | 3.5 | 35 | $567,000 | $556,492 | 98.0% |
| Jun 2026 | $529,600 | 282 | 507 | 879 | 3.1 | 43 | $570,000 | $566,721 | 98.0% |
| Jul 2026 | $527,900 | 234 | 471 | 905 | 3.9 | 40 | $553,500 | $555,610 | 98.0% |
| Aug 2026 | $526,600 | 215 | 414 | 896 | 4.2 | 43 | $538,000 | $533,022 | 97.0% |
| Sep 2026 | $523,000 | 236 | 426 | 839 | 3.6 | 46 | $556,250 | $536,268 | 97.0% |
September 2026 · detached homes
In September 2026, the benchmark price for North Calgary was $640,200, down 3.8% from September last year. 138 homes sold (up 10%), 235 new listings came on the market (down 8%), and there were 440 active listings at month end (down 9%). Among homes that sold, the median sale price was $631,000 (down 4.8%) and the average sale price was $648,846 (down 4.2%), and homes sold for 98.0% of their asking price. That is 3.2 months of supply, and homes spent 44 days on the market (up 9 days). Figures cover detached homes.
View the numbers
| Measure | September 2026 | September last year |
|---|---|---|
| Benchmark price | $640,200 | $665,500 |
| Median price | $631,000 | $662,500 |
| Average price | $648,846 | $677,532 |
| Sold vs asking | 98.0% | 98.0% |
| Homes sold | 138 | 125 |
| New listings | 235 | 255 |
| Active listings | 440 | 486 |
| Months of supply | 3.2 | 3.9 |
| Days on market | 44 | 35 |
12-month trend
View the monthly numbers
| Month | Benchmark price | Sold | New listings | Active listings | Months of supply | Days on market | Median price | Average price | Sold vs asking |
|---|---|---|---|---|---|---|---|---|---|
| Oct 2025 | $658,500 | 124 | 245 | 447 | 3.6 | 39 | $650,000 | $663,638 | 97.0% |
| Nov 2025 | $649,500 | 119 | 175 | 381 | 3.2 | 45 | $642,000 | $656,262 | 97.0% |
| Dec 2025 | $640,900 | 87 | 80 | 236 | 2.7 | 52 | $640,000 | $654,920 | 97.0% |
| Jan 2026 | $637,700 | 108 | 206 | 270 | 2.5 | 48 | $634,950 | $656,688 | 98.0% |
| Feb 2026 | $645,700 | 106 | 200 | 312 | 2.9 | 35 | $641,250 | $665,527 | 99.0% |
| Mar 2026 | $646,800 | 128 | 234 | 370 | 2.9 | 31 | $635,000 | $652,228 | 99.0% |
| Apr 2026 | $645,400 | 162 | 280 | 402 | 2.5 | 30 | $655,000 | $665,649 | 98.0% |
| May 2026 | $647,200 | 151 | 312 | 452 | 3.0 | 31 | $651,510 | $672,095 | 99.0% |
| Jun 2026 | $651,600 | 177 | 288 | 449 | 2.5 | 39 | $655,000 | $673,111 | 98.0% |
| Jul 2026 | $647,700 | 149 | 262 | 453 | 3.0 | 37 | $630,000 | $659,449 | 98.0% |
| Aug 2026 | $647,400 | 114 | 236 | 474 | 4.2 | 39 | $634,500 | $661,831 | 98.0% |
| Sep 2026 | $640,200 | 138 | 235 | 440 | 3.2 | 44 | $631,000 | $648,846 | 98.0% |
September 2026 · semi-detached homes
In September 2026, the benchmark price for North Calgary was $484,100, down 1.6% from September last year. 17 homes sold (down 6%), 44 new listings came on the market (up 2%), and there were 76 active listings at month end (up 3%). Among homes that sold, the median sale price was $552,500 (up 9.0%) and the average sale price was $512,413 (up 0.8%), and homes sold for 94.0% of their asking price. That is 4.5 months of supply, and homes spent 45 days on the market (down 2 days). Figures cover semi-detached homes.
View the numbers
| Measure | September 2026 | September last year |
|---|---|---|
| Benchmark price | $484,100 | $491,800 |
| Median price | $552,500 | $507,000 |
| Average price | $512,413 | $508,121 |
| Sold vs asking | 94.0% | 97.0% |
| Homes sold | 17 | 18 |
| New listings | 44 | 43 |
| Active listings | 76 | 74 |
| Months of supply | 4.5 | 4.1 |
| Days on market | 45 | 47 |
12-month trend
View the monthly numbers
| Month | Benchmark price | Sold | New listings | Active listings | Months of supply | Days on market | Median price | Average price | Sold vs asking |
|---|---|---|---|---|---|---|---|---|---|
| Oct 2025 | $490,600 | 25 | 39 | 70 | 2.8 | 50 | $550,000 | $568,011 | 98.0% |
| Nov 2025 | $481,400 | 18 | 23 | 60 | 3.3 | 45 | $545,000 | $552,527 | 97.0% |
| Dec 2025 | $475,200 | 11 | 16 | 44 | 4.0 | 64 | $535,000 | $505,555 | 97.0% |
| Jan 2026 | $475,300 | 14 | 23 | 45 | 3.2 | 83 | $564,000 | $605,127 | 97.0% |
| Feb 2026 | $488,500 | 17 | 20 | 42 | 2.5 | 56 | $559,000 | $548,588 | 97.0% |
| Mar 2026 | $492,800 | 25 | 36 | 44 | 1.8 | 50 | $550,000 | $544,864 | 98.0% |
| Apr 2026 | $492,900 | 25 | 38 | 54 | 2.2 | 27 | $548,000 | $544,800 | 98.0% |
| May 2026 | $496,100 | 13 | 38 | 77 | 5.9 | 38 | $488,000 | $512,365 | 98.0% |
| Jun 2026 | $496,600 | 23 | 44 | 73 | 3.2 | 35 | $520,000 | $519,278 | 97.0% |
| Jul 2026 | $492,700 | 20 | 49 | 84 | 4.2 | 38 | $495,000 | $497,419 | 97.0% |
| Aug 2026 | $492,300 | 23 | 34 | 72 | 3.1 | 44 | $514,000 | $508,478 | 98.0% |
| Sep 2026 | $484,100 | 17 | 44 | 76 | 4.5 | 45 | $552,500 | $512,413 | 94.0% |
September 2026 · row and townhouse homes
In September 2026, the benchmark price for North Calgary was $373,400, down 7.3% from September last year. 50 homes sold (unchanged), 89 new listings came on the market (down 20%), and there were 178 active listings at month end (down 5%). Among homes that sold, the median sale price was $391,750 (up 0.5%) and the average sale price was $386,755 (down 3.0%), and homes sold for 97.0% of their asking price. That is 3.6 months of supply, and homes spent 48 days on the market (up 3 days). Figures cover row and townhouse homes.
View the numbers
| Measure | September 2026 | September last year |
|---|---|---|
| Benchmark price | $373,400 | $402,600 |
| Median price | $391,750 | $389,750 |
| Average price | $386,755 | $398,523 |
| Sold vs asking | 97.0% | 97.0% |
| Homes sold | 50 | 50 |
| New listings | 89 | 111 |
| Active listings | 178 | 187 |
| Months of supply | 3.6 | 3.7 |
| Days on market | 48 | 45 |
12-month trend
View the monthly numbers
| Month | Benchmark price | Sold | New listings | Active listings | Months of supply | Days on market | Median price | Average price | Sold vs asking |
|---|---|---|---|---|---|---|---|---|---|
| Oct 2025 | $398,600 | 44 | 91 | 179 | 4.1 | 39 | $414,500 | $413,016 | 97.0% |
| Nov 2025 | $392,600 | 37 | 53 | 149 | 4.0 | 55 | $400,000 | $396,233 | 97.0% |
| Dec 2025 | $391,100 | 29 | 26 | 103 | 3.6 | 51 | $390,000 | $388,707 | 97.0% |
| Jan 2026 | $388,300 | 30 | 82 | 122 | 4.1 | 64 | $402,000 | $401,856 | 98.0% |
| Feb 2026 | $388,000 | 39 | 65 | 127 | 3.3 | 43 | $435,000 | $423,036 | 98.0% |
| Mar 2026 | $389,400 | 46 | 88 | 138 | 3.0 | 40 | $435,500 | $429,892 | 98.0% |
| Apr 2026 | $386,200 | 60 | 111 | 153 | 2.6 | 34 | $427,500 | $427,852 | 98.0% |
| May 2026 | $385,000 | 58 | 100 | 164 | 2.8 | 36 | $422,500 | $412,740 | 98.0% |
| Jun 2026 | $383,600 | 44 | 106 | 185 | 4.2 | 46 | $398,000 | $404,255 | 98.0% |
| Jul 2026 | $380,700 | 32 | 82 | 190 | 5.9 | 44 | $402,750 | $394,742 | 97.0% |
| Aug 2026 | $373,900 | 40 | 94 | 202 | 5.1 | 46 | $394,800 | $395,088 | 97.0% |
| Sep 2026 | $373,400 | 50 | 89 | 178 | 3.6 | 48 | $391,750 | $386,755 | 97.0% |
September 2026 · apartment condos
In September 2026, the benchmark price for North Calgary was $298,400, down 9.0% from September last year. 31 homes sold (up 11%), 58 new listings came on the market (down 12%), and there were 145 active listings at month end (up 4%). Among homes that sold, the median sale price was $280,000 (down 7.4%) and the average sale price was $289,345 (down 5.3%), and homes sold for 96.0% of their asking price. That is 4.7 months of supply, and homes spent 55 days on the market (down 7 days). Figures cover apartment condos.
View the numbers
| Measure | September 2026 | September last year |
|---|---|---|
| Benchmark price | $298,400 | $328,000 |
| Median price | $280,000 | $302,500 |
| Average price | $289,345 | $305,450 |
| Sold vs asking | 96.0% | 97.0% |
| Homes sold | 31 | 28 |
| New listings | 58 | 66 |
| Active listings | 145 | 140 |
| Months of supply | 4.7 | 5.0 |
| Days on market | 55 | 62 |
12-month trend
View the monthly numbers
| Month | Benchmark price | Sold | New listings | Active listings | Months of supply | Days on market | Median price | Average price | Sold vs asking |
|---|---|---|---|---|---|---|---|---|---|
| Oct 2025 | $322,200 | 33 | 61 | 138 | 4.2 | 47 | $282,000 | $293,494 | 97.0% |
| Nov 2025 | $316,500 | 20 | 42 | 121 | 6.1 | 43 | $288,750 | $283,925 | 97.0% |
| Dec 2025 | $311,800 | 26 | 39 | 93 | 3.6 | 57 | $269,500 | $277,497 | 97.0% |
| Jan 2026 | $306,700 | 15 | 67 | 129 | 8.6 | 62 | $307,500 | $355,496 | 96.0% |
| Feb 2026 | $303,800 | 40 | 79 | 146 | 3.7 | 65 | $307,500 | $313,433 | 98.0% |
| Mar 2026 | $301,900 | 35 | 64 | 147 | 4.2 | 45 | $310,000 | $312,936 | 97.0% |
| Apr 2026 | $300,300 | 28 | 78 | 172 | 6.1 | 58 | $278,750 | $308,739 | 97.0% |
| May 2026 | $300,800 | 30 | 79 | 185 | 6.2 | 52 | $267,950 | $271,663 | 97.0% |
| Jun 2026 | $301,000 | 38 | 69 | 172 | 4.5 | 62 | $281,250 | $288,004 | 96.0% |
| Jul 2026 | $301,000 | 33 | 78 | 178 | 5.4 | 50 | $280,000 | $278,026 | 96.0% |
| Aug 2026 | $300,900 | 38 | 50 | 148 | 3.9 | 54 | $299,950 | $306,648 | 97.0% |
| Sep 2026 | $298,400 | 31 | 58 | 145 | 4.7 | 55 | $280,000 | $289,345 | 96.0% |
Source: Calgary Real Estate Board (CREB®) monthly statistics. Benchmark price is the typical price of a home in the area. Median and average prices are for homes that sold in the month. Figures can be revised.
Sign Up for free
Get the first to receive the latest listing updates, save favorites & much more by signing up. Or already have in account,Sign in.
Keystone Hills MLS® Listings - Houses, Condos and Real Estate For Sale in North Calgary
- All Listings
- $400,000 - $500,000
- $500,000 - $600,000
- $600,000 - $700,000



About Keystone Hills
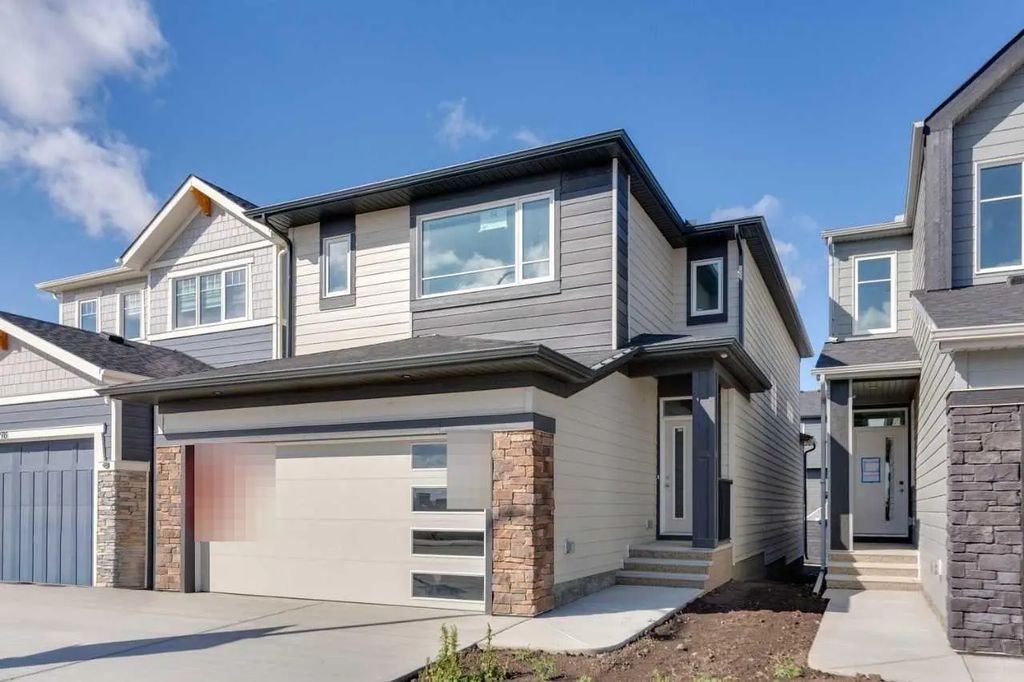
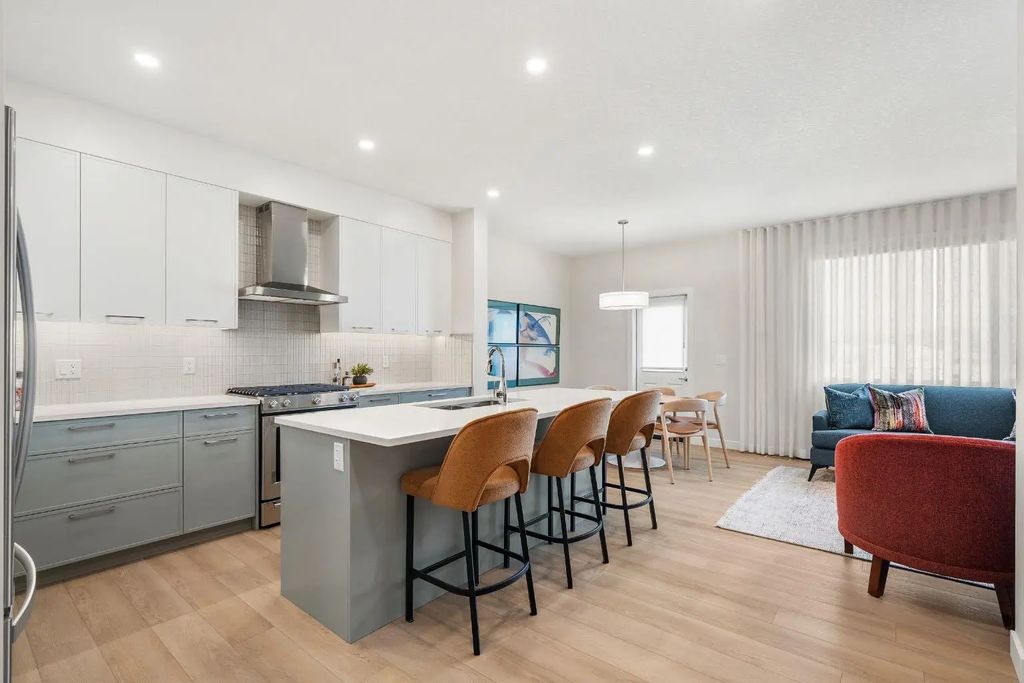
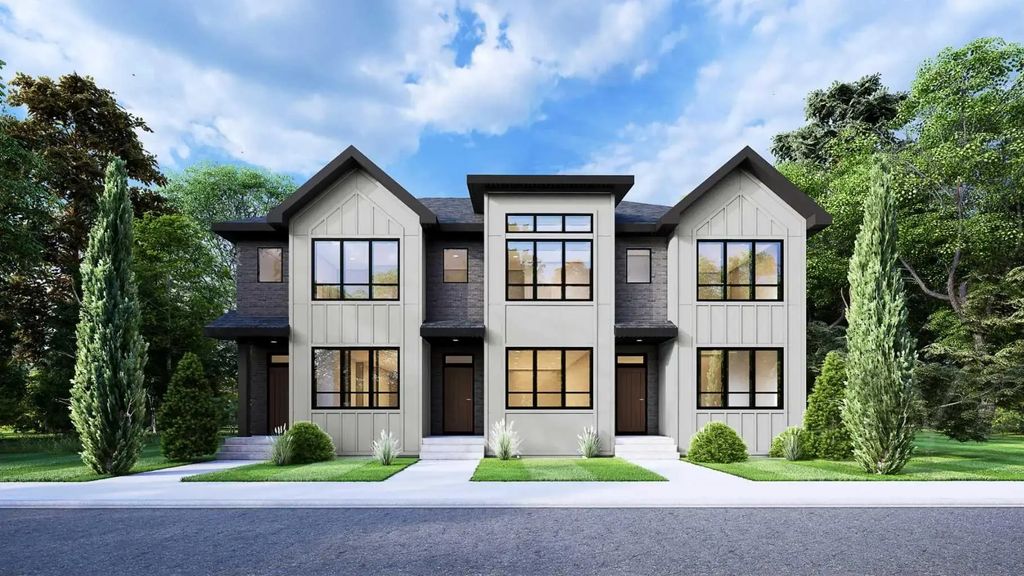
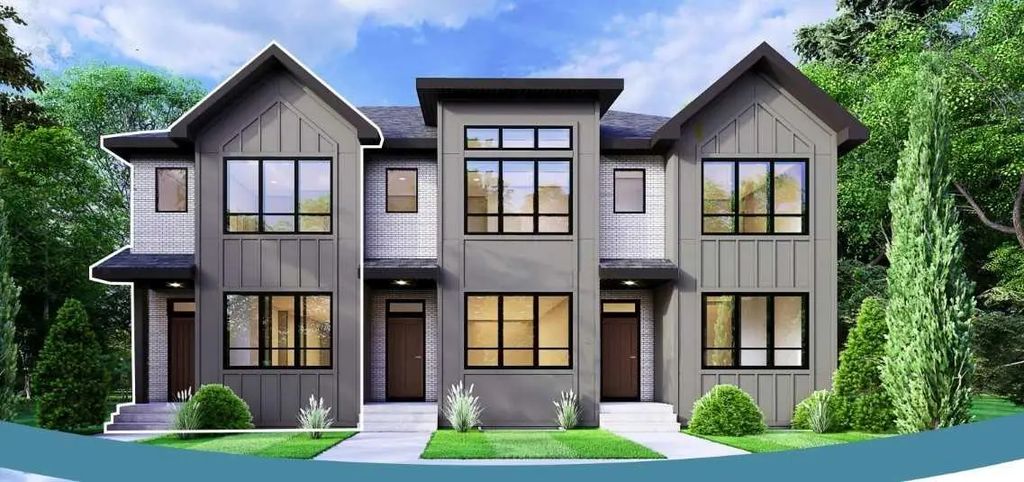
Keystone Hills is a newer community in far north Calgary, part of the Symons Valley area near Stoney Trail and Symons Valley Parkway. It offers a mix of single-family homes and townhomes, with parks and pathways planned throughout as the community continues to develop. Its location provides quick access to Beacon Hill and Creekside shopping centres, along with a straightforward commute via Stoney Trail.
Frequently Asked Questions
What kind of homes are in Keystone Hills?
Keystone Hills offers a mix of single-family homes and townhomes.
What’s nearby Keystone Hills?
Beacon Hill and Creekside shopping centres are just minutes away, along with quick access to Stoney Trail for commuting across the city.
Is Keystone Hills a good fit for families?
Yes — as a newer north Calgary community, Keystone Hills is being built with parks, pathways and schools in mind.
Featured Neighbourhoods in North Calgary
- Ambleridge
- Beddington Heights
- Carrington
- Country Hills
- Country Hills Village
- Coventry Hills
- Evanston
- Glacier Ridge
- Harvest Hills
- Hidden Valley
- Huntington Hills
- Keystone Hills
- Kincora
- Lewisburg
- Livingston
- MacEwan Glen
- Moraine
- Nolan Hill
- North Haven
- Panorama Hills
- Sage Hill
- Sandstone Valley
- Sherwood
- Symons Valley Ranch
- Thorncliffe