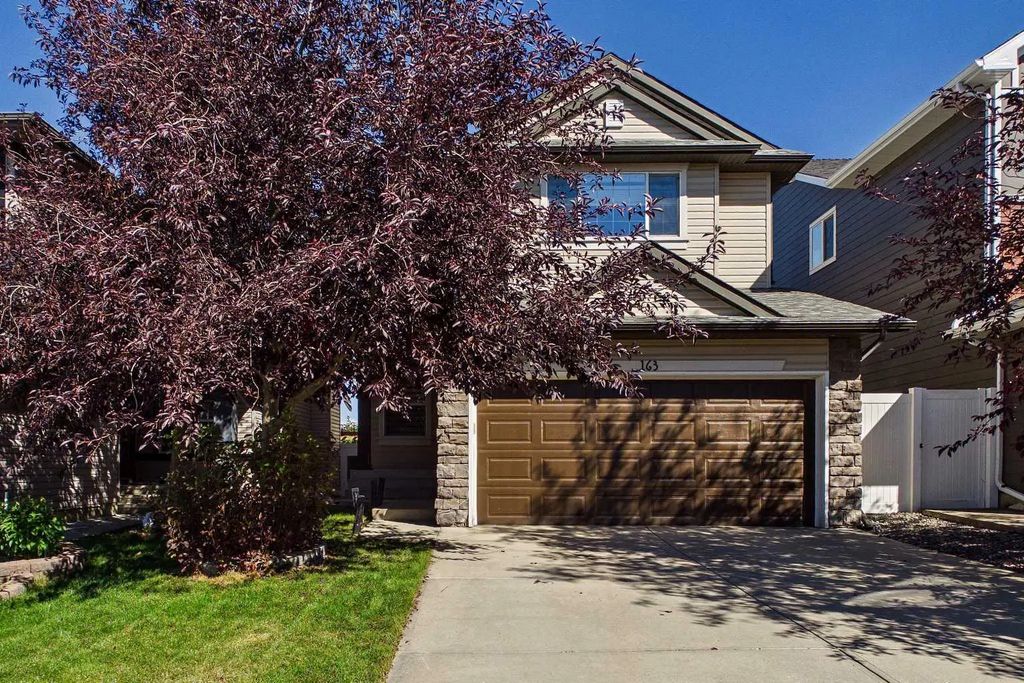
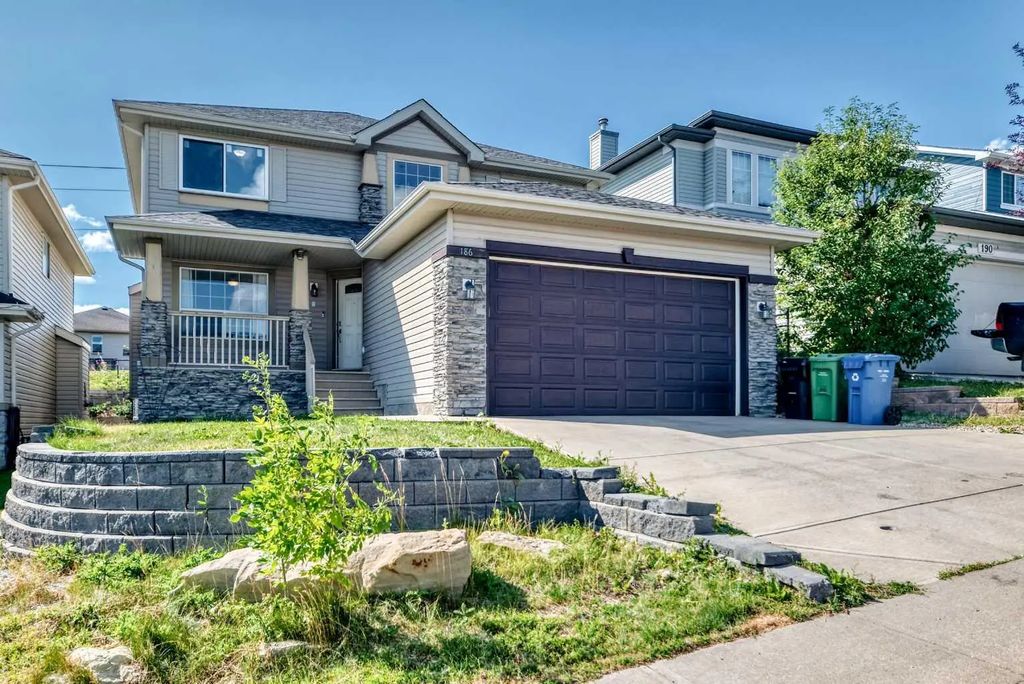
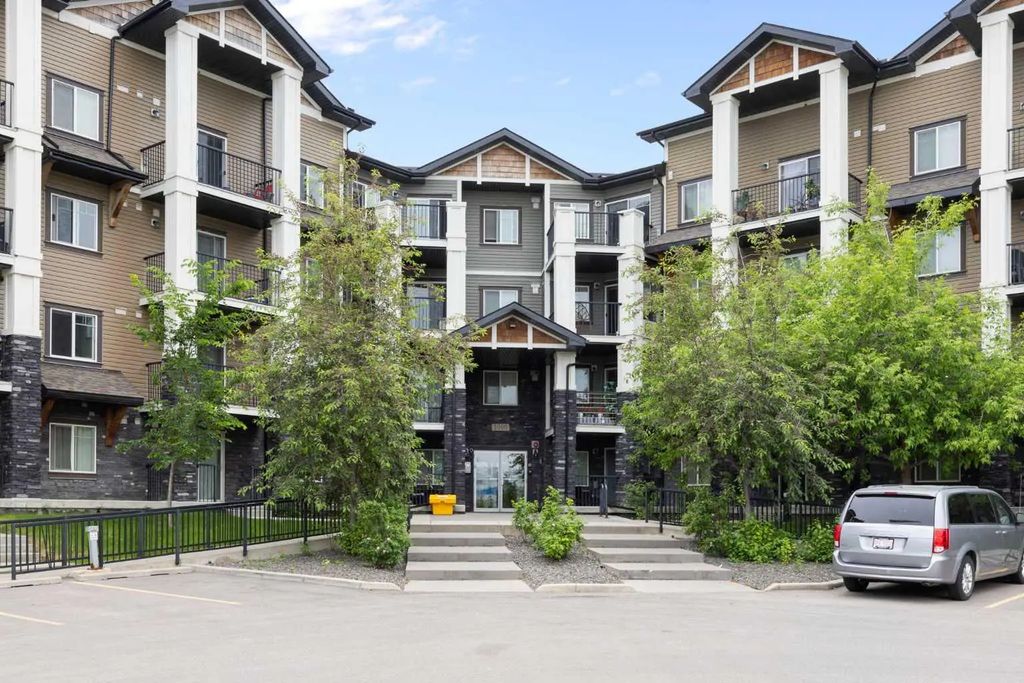
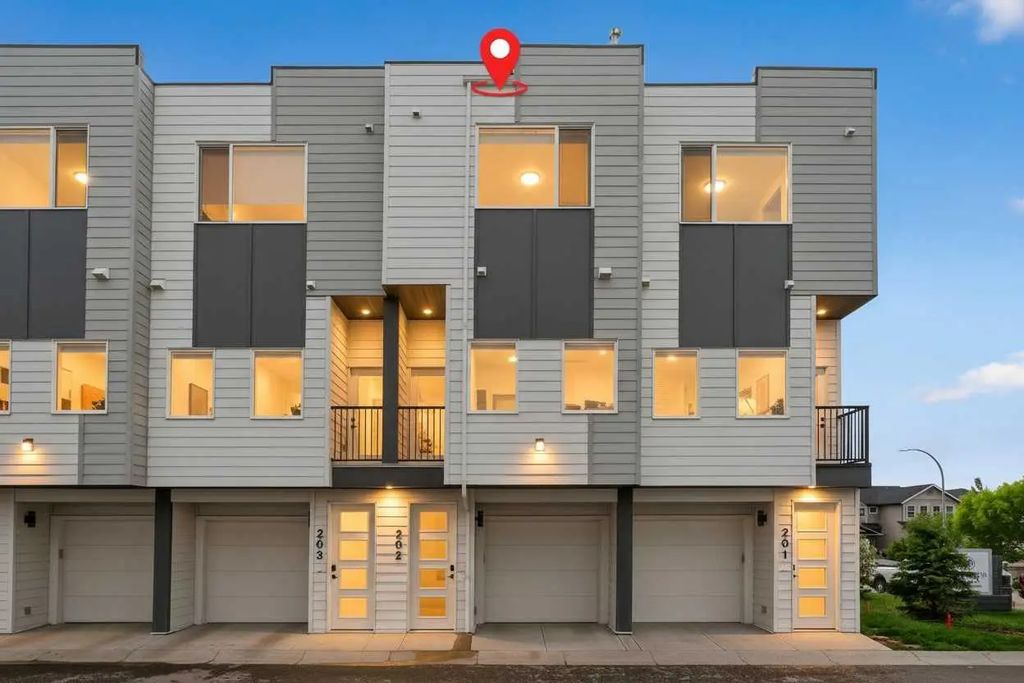
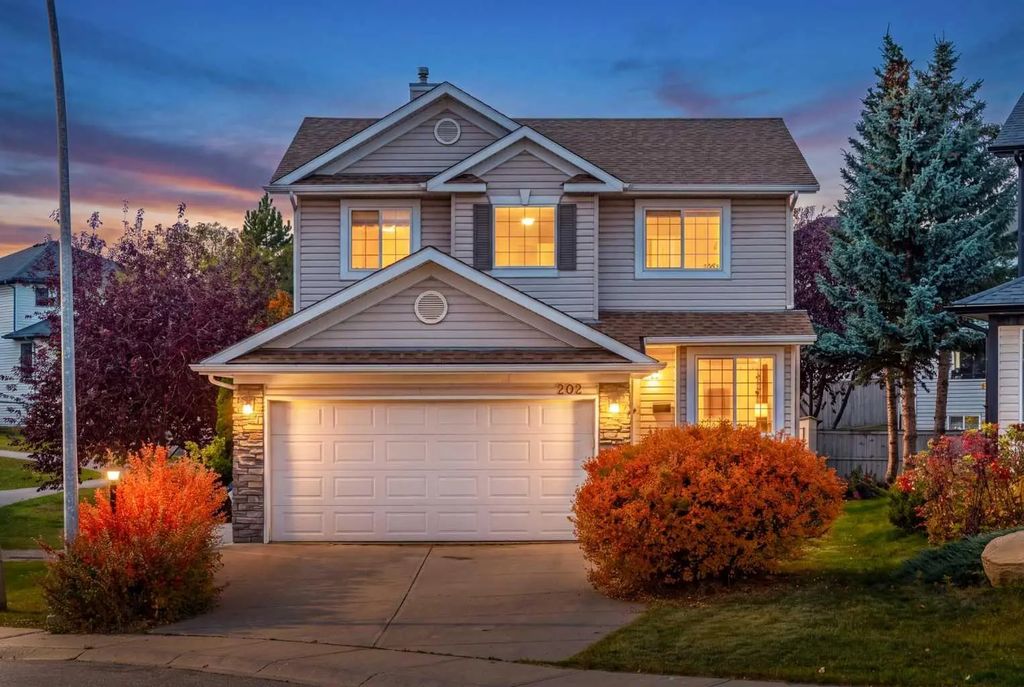
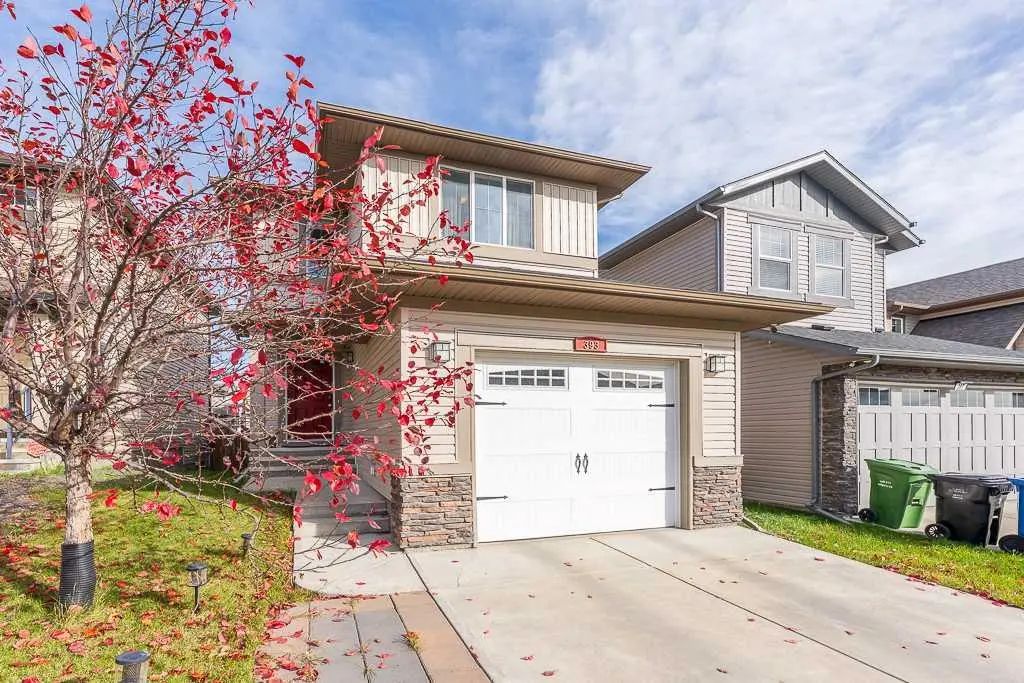
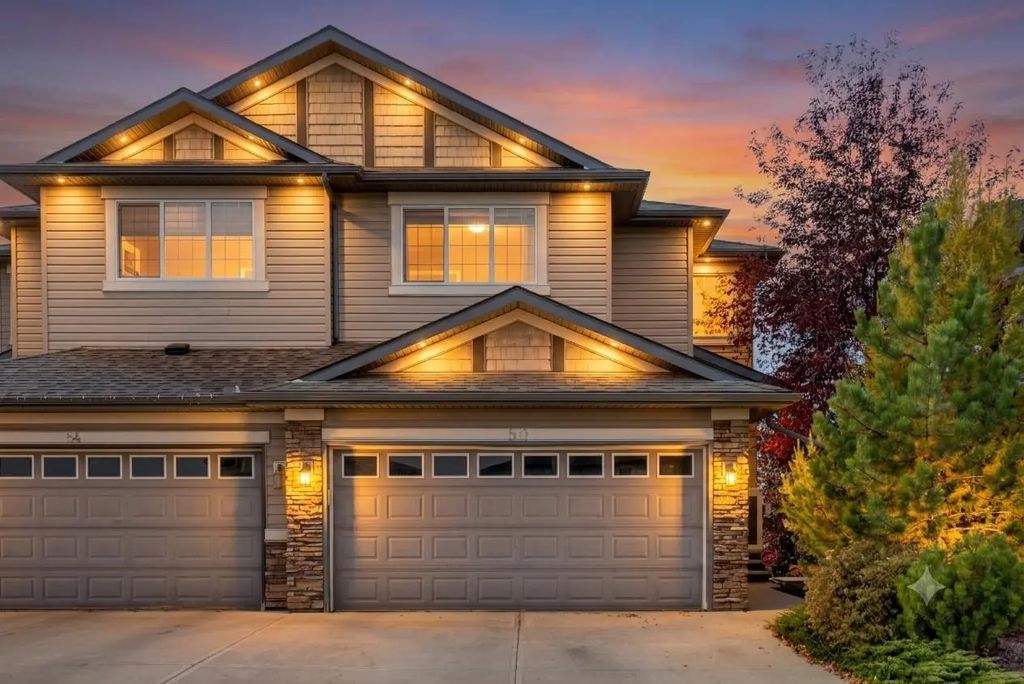
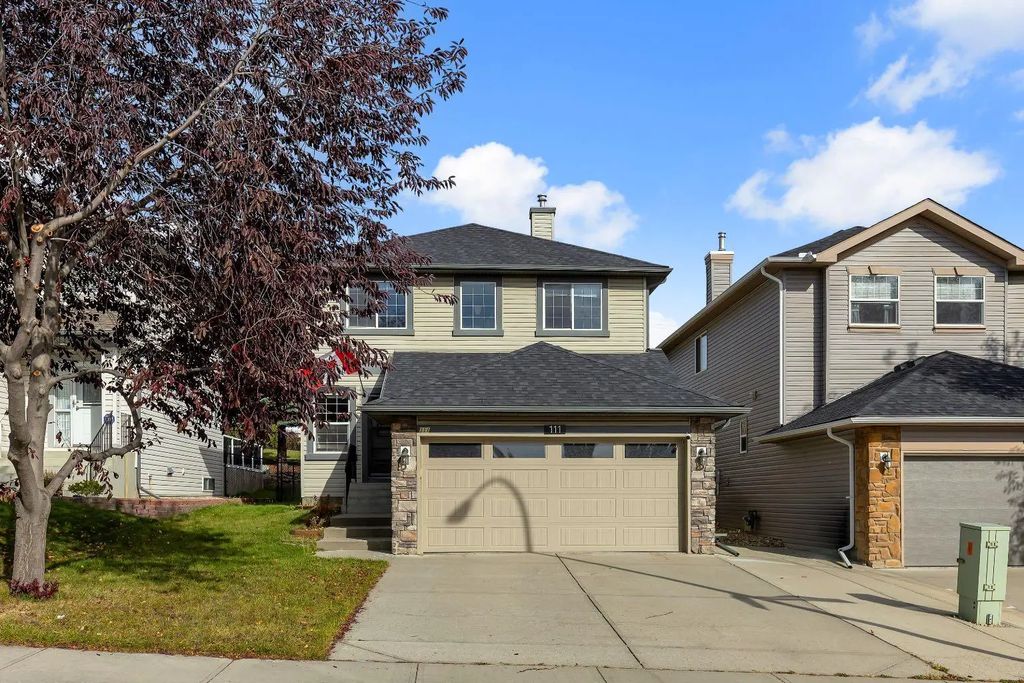
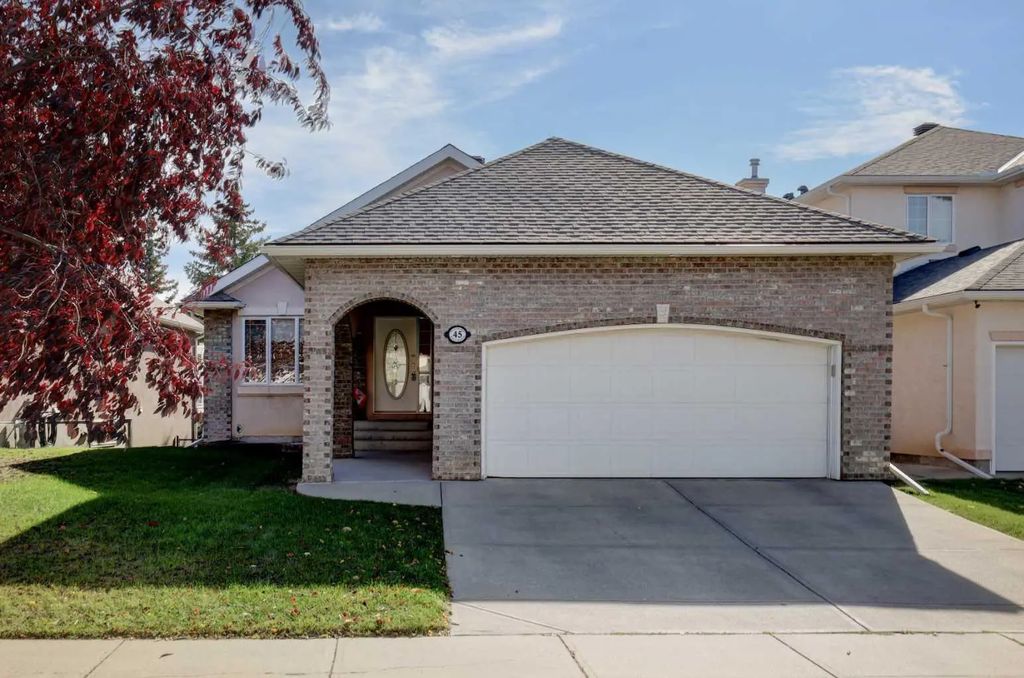
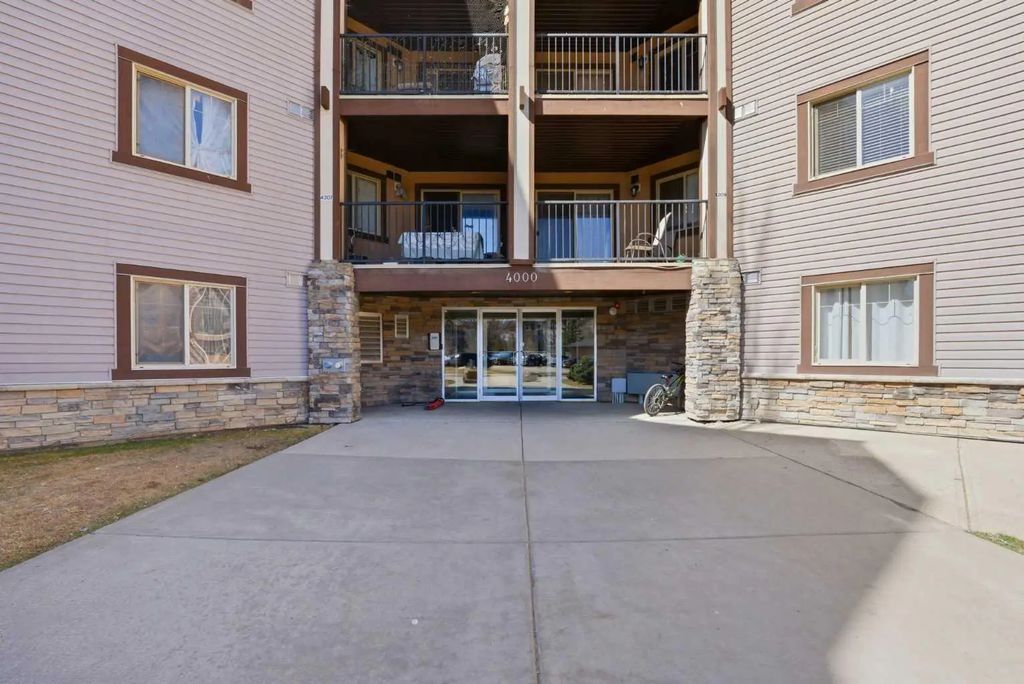
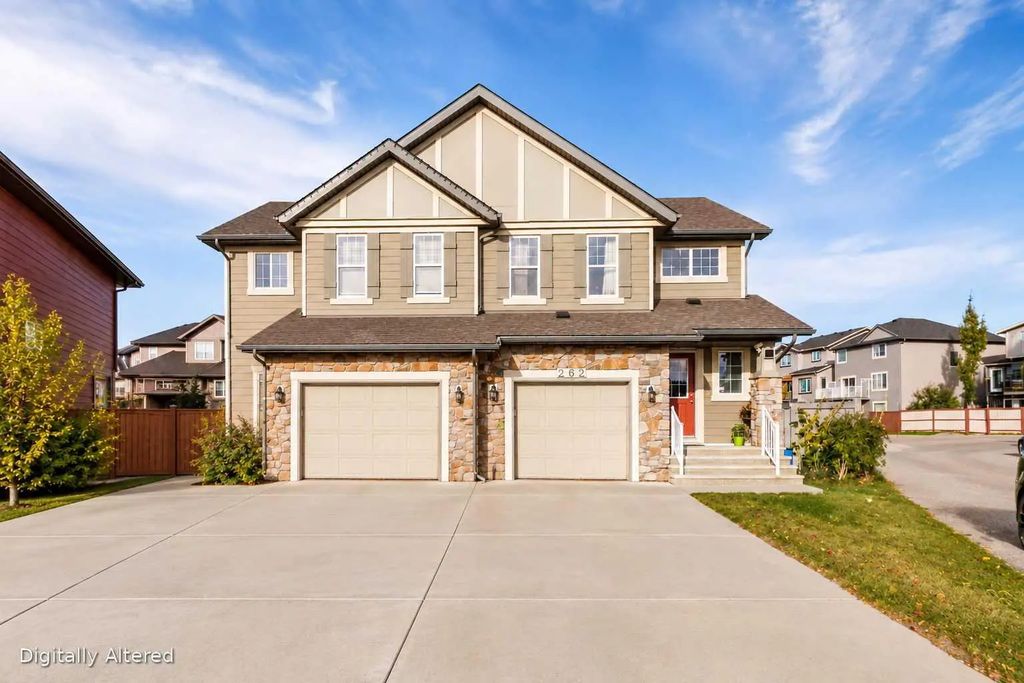
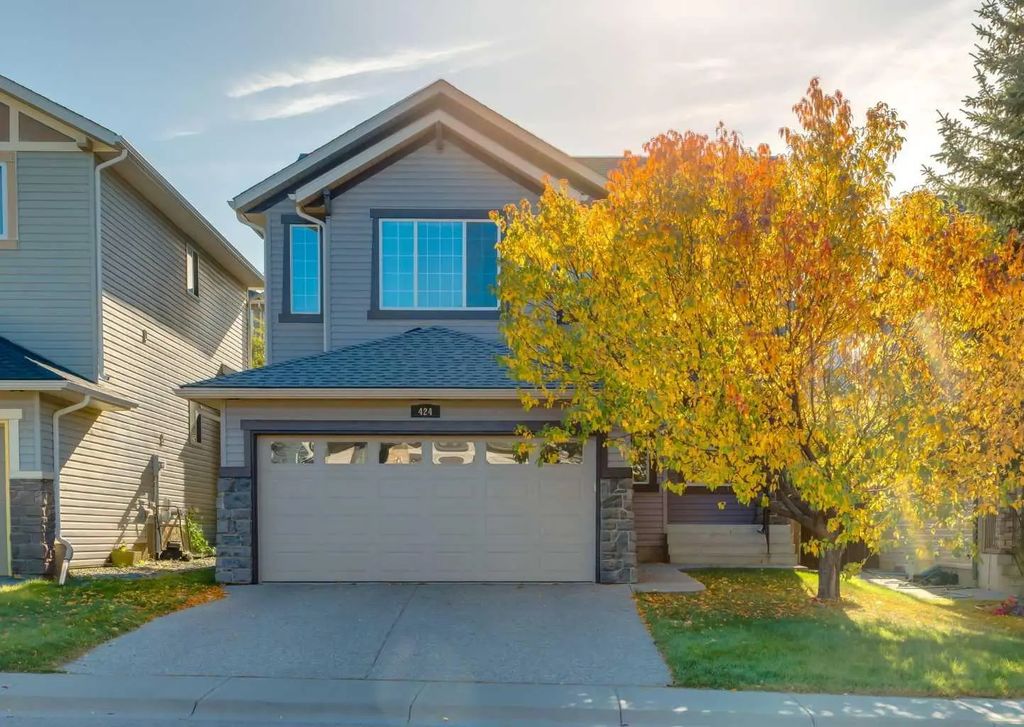
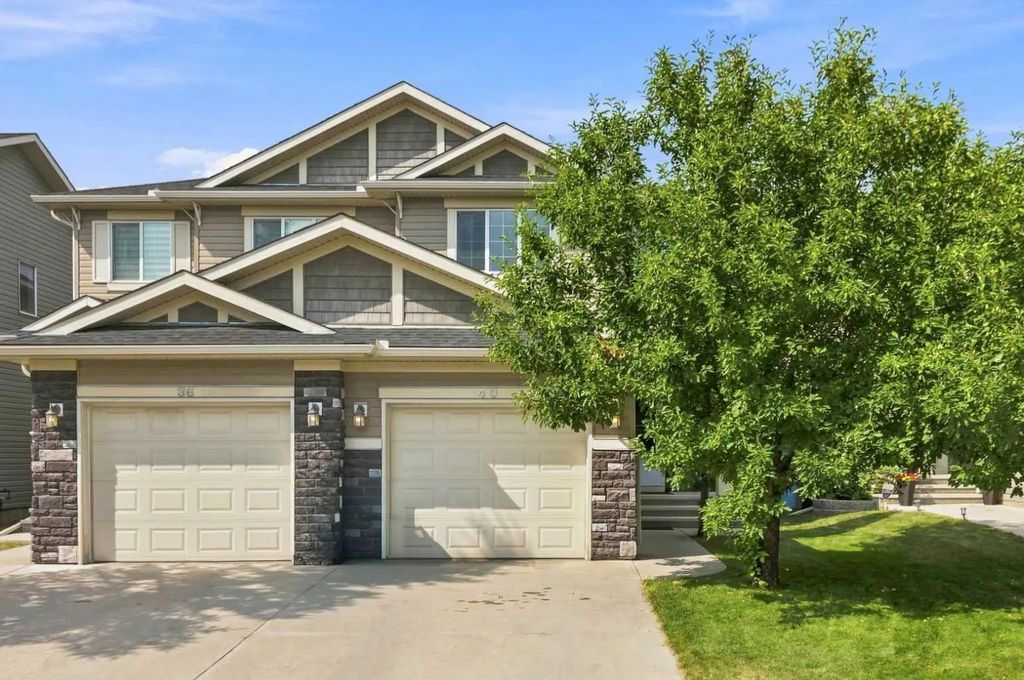
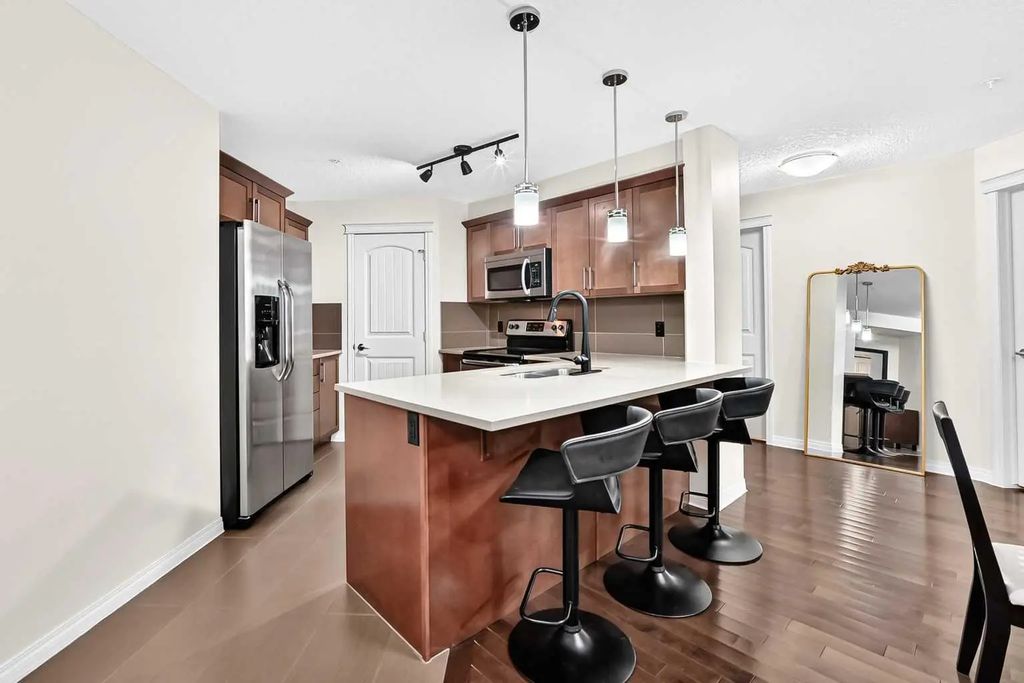
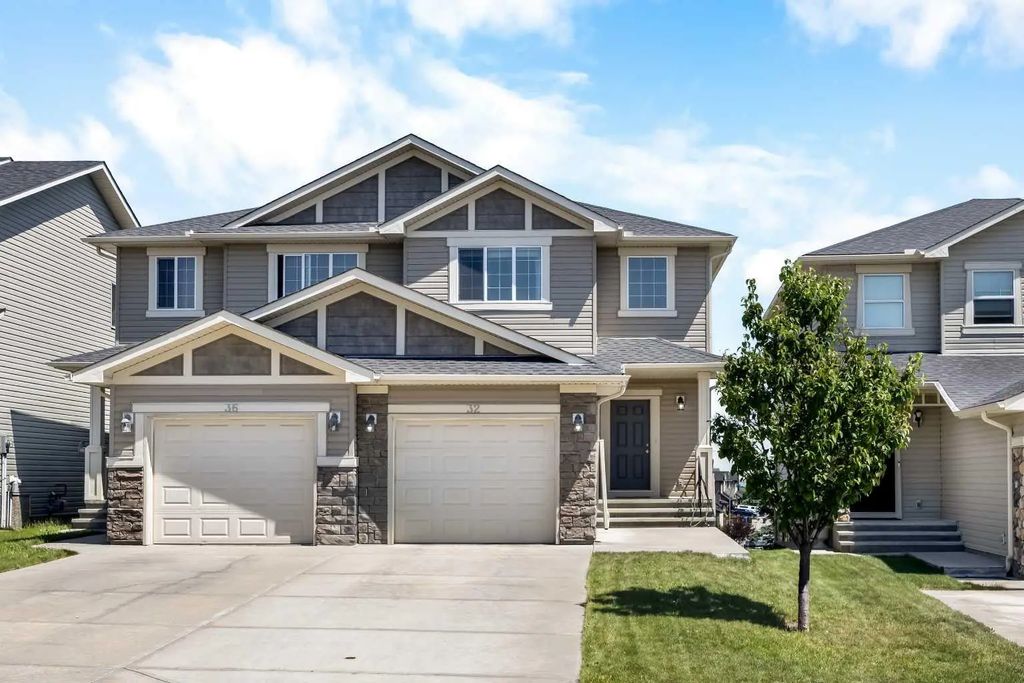
In September 2026, the benchmark price for Panorama Hills was $508,300, down 1.0% from September last year. 30 homes sold (up 67%), 44 new listings came on the market (down 17%), and there were 94 active listings at month end (down 7%). Among homes that sold, the median sale price was $394,500 (down 39.9%) and the average sale price was $483,447 (down 14.1%), and homes sold for 97.0% of their asking price. That is 3.1 months of supply, and homes spent 45 days on the market (up 8 days). Figures cover all residential property types.
View the numbers
Measure
September 2026
September last year
Benchmark price
$508,300
$513,300
Median price
$394,500
$656,000
Average price
$483,447
$562,556
Sold vs asking
97.0%
97.0%
Homes sold
30
18
New listings
44
53
Active listings
94
101
Months of supply
3.1
5.6
Days on market
45
37
ShowHide 12-month trend
Benchmark price
$508,300
Oct 2025Sep 2026
Up 0.1% since Oct 2025
Median price
$394,500
Oct 2025Sep 2026
Down 38.3% since Oct 2025
Homes sold
30
Oct 2025Sep 2026
Range 17 to 36
Active listings
94
Oct 2025Sep 2026
Range 50 to 110
Months of supply
3.1
Oct 2025Sep 2026
Range 2.5 to 5.0
Sold vs asking
97.0%
Oct 2025Sep 2026
Range 97.0% to 99.0%
Last 12 monthsSame months a year earlier (dashed)
View the monthly numbers
Month
Benchmark price
Sold
New listings
Active listings
Months of supply
Days on market
Median price
Average price
Sold vs asking
Oct 2025
$507,600
21
57
105
5.0
39
$639,000
$559,595
98.0%
Nov 2025
$496,400
23
30
87
3.8
49
$535,000
$554,348
97.0%
Dec 2025
$496,900
20
16
50
2.5
56
$589,250
$554,450
98.0%
Jan 2026
$493,600
20
43
62
3.1
54
$679,000
$624,312
98.0%
Feb 2026
$504,000
17
44
74
4.4
34
$630,000
$634,806
99.0%
Mar 2026
$495,700
24
47
82
3.4
37
$505,000
$498,842
98.0%
Apr 2026
$493,600
32
66
100
3.1
30
$597,500
$569,675
98.0%
May 2026
$501,800
23
57
109
4.7
31
$651,510
$597,013
98.0%
Jun 2026
$507,600
36
54
95
2.6
40
$675,000
$649,381
97.0%
Jul 2026
$510,200
24
56
107
4.5
34
$691,375
$623,219
97.0%
Aug 2026
$511,900
28
56
110
3.9
39
$544,250
$559,777
98.0%
Sep 2026
$508,300
30
44
94
3.1
45
$394,500
$483,447
97.0%
September 2026 · detached homes
Benchmark price
$715,100
▼ 3.7% vs Sept 2025
Homes sold
12
▲ 20% vs Sept 2025
Active listings
39
▼ 26% vs Sept 2025
Months of supply
3.3
▼ 2.1 vs Sept 2025
Days on market
41
▲ 6 days vs Sept 2025
Sold vs asking
96.0%
▼ 2.0 pts vs Sept 2025
September 2026September last year
In September 2026, the benchmark price for Panorama Hills was $715,100, down 3.7% from September last year. 12 homes sold (up 20%), 18 new listings came on the market (down 40%), and there were 39 active listings at month end (down 26%). Among homes that sold, the median sale price was $710,000 (up 0.5%) and the average sale price was $758,125 (up 1.0%), and homes sold for 96.0% of their asking price. That is 3.3 months of supply, and homes spent 41 days on the market (up 6 days). Figures cover detached homes.
View the numbers
Measure
September 2026
September last year
Benchmark price
$715,100
$742,500
Median price
$710,000
$706,750
Average price
$758,125
$750,760
Sold vs asking
96.0%
98.0%
Homes sold
12
10
New listings
18
30
Active listings
39
53
Months of supply
3.3
5.3
Days on market
41
35
ShowHide 12-month trend
Benchmark price
$715,100
Oct 2025Sep 2026
Down 2.7% since Oct 2025
Median price
$710,000
Oct 2025Sep 2026
Up 1.8% since Oct 2025
Homes sold
12
Oct 2025Sep 2026
Range 8 to 26
Active listings
39
Oct 2025Sep 2026
Range 25 to 53
Months of supply
3.3
Oct 2025Sep 2026
Range 1.5 to 4.9
Sold vs asking
96.0%
Oct 2025Sep 2026
Range 96.0% to 100.0%
Last 12 monthsSame months a year earlier (dashed)
View the monthly numbers
Month
Benchmark price
Sold
New listings
Active listings
Months of supply
Days on market
Median price
Average price
Sold vs asking
Oct 2025
$735,300
12
30
53
4.4
38
$697,500
$742,292
98.0%
Nov 2025
$712,900
12
20
48
4.0
43
$748,500
$765,083
97.0%
Dec 2025
$716,300
12
9
25
2.1
48
$717,250
$710,542
98.0%
Jan 2026
$709,200
13
26
34
2.6
44
$775,000
$799,292
98.0%
Feb 2026
$732,000
11
18
34
3.1
29
$730,000
$794,136
100.0%
Mar 2026
$718,800
8
21
39
4.9
33
$730,000
$726,362
99.0%
Apr 2026
$712,300
18
31
43
2.4
31
$715,000
$719,517
98.0%
May 2026
$724,400
13
33
51
3.9
28
$780,000
$803,293
99.0%
Jun 2026
$726,000
26
23
38
1.5
38
$732,200
$770,628
97.0%
Jul 2026
$721,900
16
31
46
2.9
37
$732,500
$761,234
98.0%
Aug 2026
$722,700
12
24
48
4.0
31
$777,500
$784,504
98.0%
Sep 2026
$715,100
12
18
39
3.3
41
$710,000
$758,125
96.0%
September 2026 · row and townhouse homes
Benchmark price
$357,500
▼ 8.7% vs Sept 2025
Homes sold
9
▲ 200% vs Sept 2025
Active listings
23
▼ 8% vs Sept 2025
Months of supply
2.6
▼ 5.8 vs Sept 2025
Days on market
45
▲ 1 days vs Sept 2025
Sold vs asking
97.0%
▬ No change vs Sept 2025
September 2026September last year
In September 2026, the benchmark price for Panorama Hills was $357,500, down 8.7% from September last year. 9 homes sold (up 200%), 11 new listings came on the market (down 15%), and there were 23 active listings at month end (down 8%). Among homes that sold, the median sale price was $355,000 (up 18.4%) and the average sale price was $327,667 (down 1.3%), and homes sold for 97.0% of their asking price. That is 2.6 months of supply, and homes spent 45 days on the market (up 1 days). Figures cover row and townhouse homes.
View the numbers
Measure
September 2026
September last year
Benchmark price
$357,500
$391,500
Median price
$355,000
$299,900
Average price
$327,667
$332,133
Sold vs asking
97.0%
97.0%
Homes sold
9
3
New listings
11
13
Active listings
23
25
Months of supply
2.6
8.3
Days on market
45
44
ShowHide 12-month trend
Benchmark price
$357,500
Oct 2025Sep 2026
Down 7.4% since Oct 2025
Median price
$355,000
Oct 2025Sep 2026
Down 13.8% since Oct 2025
Homes sold
9
Oct 2025Sep 2026
Range 3 to 9
Active listings
23
Oct 2025Sep 2026
Range 11 to 28
Months of supply
2.6
Oct 2025Sep 2026
Range 2.6 to 9.0
Sold vs asking
97.0%
Oct 2025Sep 2026
Range 96.0% to 100.0%
Last 12 monthsSame months a year earlier (dashed)
View the monthly numbers
Month
Benchmark price
Sold
New listings
Active listings
Months of supply
Days on market
Median price
Average price
Sold vs asking
Oct 2025
$386,000
3
14
27
9.0
60
$412,000
$361,333
97.0%
Nov 2025
$376,600
6
6
20
3.3
60
$389,250
$372,750
96.0%
Dec 2025
$373,800
3
1
12
4.0
46
$411,000
$412,833
98.0%
Jan 2026
$368,100
4
8
11
2.8
37
$302,500
$313,750
100.0%
Feb 2026
$367,000
4
14
16
4.0
34
$424,000
$384,300
97.0%
Mar 2026
$367,900
5
6
15
3.0
40
$399,000
$439,300
97.0%
Apr 2026
$362,800
5
8
15
3.0
48
$400,000
$402,500
97.0%
May 2026
$363,100
4
8
15
3.8
31
$403,750
$397,625
99.0%
Jun 2026
$363,100
3
16
23
7.7
41
$399,000
$383,000
98.0%
Jul 2026
$362,500
0
4
24
n/a
n/a
n/a
n/a
n/a
Aug 2026
$358,800
5
17
28
5.6
38
$395,000
$429,120
96.0%
Sep 2026
$357,500
9
11
23
2.6
45
$355,000
$327,667
97.0%
September 2026 · apartment condos
Benchmark price
$274,000
▼ 9.0% vs Sept 2025
Homes sold
8
▲ 100% vs Sept 2025
Active listings
26
▲ 53% vs Sept 2025
Months of supply
3.3
▼ 1.0 vs Sept 2025
Days on market
54
▲ 16 days vs Sept 2025
Sold vs asking
97.0%
▬ No change vs Sept 2025
September 2026September last year
In September 2026, the benchmark price for Panorama Hills was $274,000, down 9.0% from September last year. 8 homes sold (up 100%), 11 new listings came on the market (up 38%), and there were 26 active listings at month end (up 53%). Among homes that sold, the median sale price was $217,000 (down 20.9%) and the average sale price was $231,488 (down 16.4%), and homes sold for 97.0% of their asking price. That is 3.3 months of supply, and homes spent 54 days on the market (up 16 days). Figures cover apartment condos.
View the numbers
Measure
September 2026
September last year
Benchmark price
$274,000
$301,200
Median price
$217,000
$274,500
Average price
$231,488
$276,750
Sold vs asking
97.0%
97.0%
Homes sold
8
4
New listings
11
8
Active listings
26
17
Months of supply
3.3
4.3
Days on market
54
38
ShowHide 12-month trend
Benchmark price
$274,000
Oct 2025Sep 2026
Down 7.3% since Oct 2025
Median price
$217,000
Oct 2025Sep 2026
Down 3.6% since Oct 2025
Homes sold
8
Oct 2025Sep 2026
Range 2 to 8
Active listings
26
Oct 2025Sep 2026
Range 12 to 35
Months of supply
3.3
Oct 2025Sep 2026
Range 2.4 to 10.5
Sold vs asking
97.0%
Oct 2025Sep 2026
Range 95.0% to 98.0%
Last 12 monthsSame months a year earlier (dashed)
View the monthly numbers
Month
Benchmark price
Sold
New listings
Active listings
Months of supply
Days on market
Median price
Average price
Sold vs asking
Oct 2025
$295,500
5
13
22
4.4
31
$225,000
$245,000
98.0%
Nov 2025
$291,400
5
4
17
3.4
48
$260,000
$266,500
97.0%
Dec 2025
$287,400
5
6
12
2.4
81
$270,000
$264,800
97.0%
Jan 2026
$283,000
3
8
15
5.0
123
$295,438
$280,146
96.0%
Feb 2026
$280,300
2
11
21
10.5
59
$259,500
$259,500
97.0%
Mar 2026
$277,300
7
14
23
3.3
48
$272,000
$268,643
96.0%
Apr 2026
$276,500
5
21
35
7.0
23
$254,400
$251,960
97.0%
May 2026
$276,700
5
12
34
6.8
37
$245,000
$245,600
96.0%
Jun 2026
$276,500
5
11
26
5.2
60
$250,888
$238,478
96.0%
Jul 2026
$277,200
5
13
28
5.6
35
$254,000
$250,900
95.0%
Aug 2026
$276,000
6
12
28
4.7
54
$241,500
$251,433
97.0%
Sep 2026
$274,000
8
11
26
3.3
54
$217,000
$231,488
97.0%
Source: Calgary Real Estate Board (CREB®) monthly statistics. Benchmark price is the typical price of a home in the area. Median and average prices are for homes that sold in the month. Figures can be revised.
Own a home in this neighbourhood?
See what it is worth today. Get your own Owner Console from Jeff and Shirley Mikolajow: a home value update by email every month, with nearby listings in your area. Free, no obligation.