
Westridge Okotoks MLS® Listings
Okotoks Market Snapshot
Westridge is part of Okotoks. CREB reports statistics for Okotoks, so this snapshot shows Okotoks.
September 2026 · all residential property types
In September 2026, the benchmark price for Okotoks was $606,800, up 0.1% from September last year. 56 homes sold (up 10%), 74 new listings came on the market (up 7%), and there were 121 active listings at month end (up 5%). Among homes that sold, the median sale price was $622,500 (up 3.8%) and the average sale price was $642,130 (up 0.3%), and homes sold for 98.0% of their asking price. That is 2.2 months of supply, and homes spent 45 days on the market (up 9 days). Figures cover all residential property types.
View the numbers
| Measure | September 2026 | September last year |
|---|---|---|
| Benchmark price | $606,800 | $605,900 |
| Median price | $622,500 | $599,900 |
| Average price | $642,130 | $640,369 |
| Sold vs asking | 98.0% | 98.0% |
| Homes sold | 56 | 51 |
| New listings | 74 | 69 |
| Active listings | 121 | 115 |
| Months of supply | 2.2 | 2.3 |
| Days on market | 45 | 36 |
ShowHide 12-month trend
View the monthly numbers
| Month | Benchmark price | Sold | New listings | Active listings | Months of supply | Days on market | Median price | Average price | Sold vs asking |
|---|---|---|---|---|---|---|---|---|---|
| Oct 2025 | $620,500 | 45 | 91 | 137 | 3.0 | 46 | $669,900 | $643,549 | 98.0% |
| Nov 2025 | $598,700 | 51 | 56 | 110 | 2.2 | 39 | $588,000 | $578,440 | 98.0% |
| Dec 2025 | $600,000 | 26 | 20 | 74 | 2.9 | 45 | $647,238 | $689,679 | 98.0% |
| Jan 2026 | $599,500 | 33 | 52 | 79 | 2.4 | 52 | $610,000 | $623,418 | 98.0% |
| Feb 2026 | $612,300 | 36 | 63 | 96 | 2.7 | 41 | $595,750 | $676,603 | 98.0% |
| Mar 2026 | $618,100 | 52 | 94 | 117 | 2.3 | 37 | $651,000 | $652,042 | 98.0% |
| Apr 2026 | $627,600 | 58 | 113 | 149 | 2.6 | 26 | $712,500 | $723,481 | 98.0% |
| May 2026 | $618,900 | 71 | 121 | 177 | 2.5 | 30 | $681,500 | $699,665 | 98.0% |
| Jun 2026 | $618,600 | 70 | 89 | 164 | 2.3 | 35 | $638,500 | $676,620 | 98.0% |
| Jul 2026 | $617,900 | 70 | 78 | 141 | 2.0 | 41 | $582,000 | $609,964 | 98.0% |
| Aug 2026 | $608,400 | 55 | 68 | 133 | 2.4 | 50 | $635,000 | $628,004 | 98.0% |
| Sep 2026 | $606,800 | 56 | 74 | 121 | 2.2 | 45 | $622,500 | $642,130 | 98.0% |
September 2026 · detached homes
In September 2026, the benchmark price for Okotoks was $680,900, down 0.4% from September last year. 40 homes sold (up 5%), 54 new listings came on the market (up 6%), and there were 78 active listings at month end (up 3%). Among homes that sold, the median sale price was $706,000 (up 4.8%) and the average sale price was $723,783 (up 0.2%), and homes sold for 98.0% of their asking price. That is 2.0 months of supply, and homes spent 48 days on the market (up 11 days). Figures cover detached homes.
View the numbers
| Measure | September 2026 | September last year |
|---|---|---|
| Benchmark price | $680,900 | $683,500 |
| Median price | $706,000 | $673,450 |
| Average price | $723,783 | $722,577 |
| Sold vs asking | 98.0% | 99.0% |
| Homes sold | 40 | 38 |
| New listings | 54 | 51 |
| Active listings | 78 | 76 |
| Months of supply | 2.0 | 2.0 |
| Days on market | 48 | 37 |
ShowHide 12-month trend
View the monthly numbers
| Month | Benchmark price | Sold | New listings | Active listings | Months of supply | Days on market | Median price | Average price | Sold vs asking |
|---|---|---|---|---|---|---|---|---|---|
| Oct 2025 | $702,400 | 29 | 56 | 88 | 3.0 | 34 | $715,000 | $757,410 | 98.0% |
| Nov 2025 | $676,300 | 32 | 36 | 72 | 2.3 | 42 | $616,000 | $683,791 | 98.0% |
| Dec 2025 | $679,200 | 18 | 14 | 44 | 2.4 | 47 | $704,750 | $765,072 | 98.0% |
| Jan 2026 | $679,000 | 23 | 36 | 48 | 2.1 | 46 | $670,000 | $717,630 | 98.0% |
| Feb 2026 | $699,900 | 22 | 45 | 65 | 3.0 | 41 | $738,500 | $837,859 | 98.0% |
| Mar 2026 | $701,600 | 34 | 73 | 89 | 2.6 | 36 | $702,500 | $720,115 | 98.0% |
| Apr 2026 | $709,300 | 46 | 76 | 100 | 2.2 | 26 | $752,500 | $801,041 | 98.0% |
| May 2026 | $698,200 | 52 | 81 | 113 | 2.2 | 26 | $740,000 | $784,687 | 98.0% |
| Jun 2026 | $695,300 | 52 | 63 | 106 | 2.0 | 39 | $695,750 | $745,488 | 98.0% |
| Jul 2026 | $695,700 | 48 | 60 | 95 | 2.0 | 40 | $633,660 | $708,749 | 98.0% |
| Aug 2026 | $685,800 | 37 | 39 | 84 | 2.3 | 48 | $709,500 | $712,670 | 98.0% |
| Sep 2026 | $680,900 | 40 | 54 | 78 | 2.0 | 48 | $706,000 | $723,783 | 98.0% |
September 2026 · semi-detached homes
In September 2026, the benchmark price for Okotoks was $566,100, down 2.7% from September last year. 7 homes sold (up 250%), 6 new listings came on the market (up 20%), and there were 8 active listings at month end (down 20%). Among homes that sold, the median sale price was $520,000 (down 2.0%) and the average sale price was $533,768 (up 0.6%), and homes sold for 99.0% of their asking price. That is 1.1 months of supply, and homes spent 34 days on the market (up 6 days). Figures cover semi-detached homes.
View the numbers
| Measure | September 2026 | September last year |
|---|---|---|
| Benchmark price | $566,100 | $581,600 |
| Median price | $520,000 | $530,500 |
| Average price | $533,768 | $530,500 |
| Sold vs asking | 99.0% | 99.0% |
| Homes sold | 7 | 2 |
| New listings | 6 | 5 |
| Active listings | 8 | 10 |
| Months of supply | 1.1 | 5.0 |
| Days on market | 34 | 28 |
ShowHide 12-month trend
View the monthly numbers
| Month | Benchmark price | Sold | New listings | Active listings | Months of supply | Days on market | Median price | Average price | Sold vs asking |
|---|---|---|---|---|---|---|---|---|---|
| Oct 2025 | $584,100 | 6 | 9 | 12 | 2.0 | 89 | $613,750 | $618,050 | 99.0% |
| Nov 2025 | $565,600 | 4 | 8 | 10 | 2.5 | 32 | $608,500 | $620,500 | 97.0% |
| Dec 2025 | $557,700 | 4 | 2 | 8 | 2.0 | 27 | $554,500 | $547,094 | 98.0% |
| Jan 2026 | $551,000 | 3 | 3 | 8 | 2.7 | 75 | $515,000 | $536,333 | 98.0% |
| Feb 2026 | $553,600 | 3 | 11 | 16 | 5.3 | 23 | $630,000 | $629,633 | 99.0% |
| Mar 2026 | $583,400 | 8 | 4 | 8 | 1.0 | 43 | $699,900 | $674,162 | 100.0% |
| Apr 2026 | $596,700 | 2 | 13 | 17 | 8.5 | 23 | $725,500 | $725,500 | 100.0% |
| May 2026 | $581,200 | 6 | 12 | 21 | 3.5 | 68 | $540,000 | $545,650 | 99.0% |
| Jun 2026 | $588,900 | 7 | 5 | 13 | 1.9 | 21 | $575,000 | $591,571 | 98.0% |
| Jul 2026 | $580,600 | 4 | 6 | 12 | 3.0 | 23 | $505,500 | $515,250 | 98.0% |
| Aug 2026 | $565,900 | 8 | 11 | 12 | 1.5 | 52 | $534,500 | $556,612 | 98.0% |
| Sep 2026 | $566,100 | 7 | 6 | 8 | 1.1 | 34 | $520,000 | $533,768 | 99.0% |
September 2026 · row and townhouse homes
In September 2026, the benchmark price for Okotoks was $463,300, down 2.5% from September last year. 3 homes sold (down 50%), 8 new listings came on the market (up 167%), and there were 19 active listings at month end (up 36%). Among homes that sold, the median sale price was $322,200 (down 24.0%) and the average sale price was $340,733 (down 20.4%), and homes sold for 98.0% of their asking price. That is 6.3 months of supply, and homes spent 34 days on the market (down 3 days). Figures cover row and townhouse homes.
View the numbers
| Measure | September 2026 | September last year |
|---|---|---|
| Benchmark price | $463,300 | $475,400 |
| Median price | $322,200 | $424,000 |
| Average price | $340,733 | $428,317 |
| Sold vs asking | 98.0% | 99.0% |
| Homes sold | 3 | 6 |
| New listings | 8 | 3 |
| Active listings | 19 | 14 |
| Months of supply | 6.3 | 2.3 |
| Days on market | 34 | 37 |
ShowHide 12-month trend
View the monthly numbers
| Month | Benchmark price | Sold | New listings | Active listings | Months of supply | Days on market | Median price | Average price | Sold vs asking |
|---|---|---|---|---|---|---|---|---|---|
| Oct 2025 | $473,700 | 3 | 12 | 19 | 6.3 | 74 | $415,000 | $390,000 | 97.0% |
| Nov 2025 | $459,400 | 7 | 4 | 11 | 1.6 | 45 | $360,000 | $379,500 | 97.0% |
| Dec 2025 | $456,500 | 4 | 1 | 7 | 1.8 | 58 | $502,500 | $493,000 | 98.0% |
| Jan 2026 | $449,500 | 1 | 5 | 10 | 10.0 | 103 | $396,000 | $396,000 | 97.0% |
| Feb 2026 | $443,700 | 4 | 3 | 7 | 1.8 | 18 | $393,000 | $391,000 | 99.0% |
| Mar 2026 | $471,900 | 5 | 7 | 7 | 1.4 | 56 | $449,500 | $467,800 | 98.0% |
| Apr 2026 | $496,000 | 3 | 12 | 15 | 5.0 | 13 | $571,100 | $481,033 | 98.0% |
| May 2026 | $476,600 | 9 | 18 | 22 | 2.4 | 23 | $435,000 | $478,839 | 99.0% |
| Jun 2026 | $483,600 | 8 | 13 | 24 | 3.0 | 20 | $420,000 | $464,250 | 99.0% |
| Jul 2026 | $473,300 | 7 | 6 | 19 | 2.7 | 33 | $420,000 | $450,071 | 97.0% |
| Aug 2026 | $465,200 | 4 | 5 | 17 | 4.3 | 59 | $500,000 | $491,250 | 98.0% |
| Sep 2026 | $463,300 | 3 | 8 | 19 | 6.3 | 34 | $322,200 | $340,733 | 98.0% |
September 2026 · apartment condos
In September 2026, the benchmark price for Okotoks was $290,300, up 5.6% from September last year. 6 homes sold (up 20%), 6 new listings came on the market (down 40%), and there were 16 active listings at month end (up 7%). Among homes that sold, the median sale price was $355,000 (up 7.6%) and the average sale price was $374,900 (up 19.4%), and homes sold for 98.0% of their asking price. That is 2.7 months of supply, and homes spent 40 days on the market (up 1 days). Figures cover apartment condos.
View the numbers
| Measure | September 2026 | September last year |
|---|---|---|
| Benchmark price | $290,300 | $274,900 |
| Median price | $355,000 | $330,000 |
| Average price | $374,900 | $314,000 |
| Sold vs asking | 98.0% | 96.0% |
| Homes sold | 6 | 5 |
| New listings | 6 | 10 |
| Active listings | 16 | 15 |
| Months of supply | 2.7 | 3.0 |
| Days on market | 40 | 39 |
ShowHide 12-month trend
View the monthly numbers
| Month | Benchmark price | Sold | New listings | Active listings | Months of supply | Days on market | Median price | Average price | Sold vs asking |
|---|---|---|---|---|---|---|---|---|---|
| Oct 2025 | $281,500 | 7 | 14 | 18 | 2.6 | 48 | $280,000 | $302,357 | 97.0% |
| Nov 2025 | $278,900 | 8 | 8 | 17 | 2.1 | 27 | $314,500 | $310,081 | 99.0% |
| Dec 2025 | $273,400 | 0 | 3 | 15 | n/a | n/a | n/a | n/a | n/a |
| Jan 2026 | $273,600 | 6 | 8 | 13 | 2.2 | 58 | $345,000 | $343,717 | 98.0% |
| Feb 2026 | $266,800 | 7 | 4 | 8 | 1.1 | 61 | $345,000 | $353,129 | 98.0% |
| Mar 2026 | $279,400 | 5 | 10 | 13 | 2.6 | 21 | $322,000 | $338,000 | 96.0% |
| Apr 2026 | $282,300 | 7 | 12 | 17 | 2.4 | 33 | $289,900 | $317,129 | 98.0% |
| May 2026 | $295,600 | 4 | 10 | 21 | 5.3 | 38 | $336,050 | $322,275 | 99.0% |
| Jun 2026 | $291,300 | 3 | 8 | 21 | 7.0 | 38 | $250,000 | $247,667 | 96.0% |
| Jul 2026 | $292,800 | 11 | 6 | 15 | 1.4 | 58 | $315,000 | $315,091 | 98.0% |
| Aug 2026 | $284,700 | 6 | 13 | 20 | 3.3 | 55 | $294,750 | $292,250 | 97.0% |
| Sep 2026 | $290,300 | 6 | 6 | 16 | 2.7 | 40 | $355,000 | $374,900 | 98.0% |
Source: Calgary Real Estate Board (CREB®) monthly statistics. Benchmark price is the typical price of a home in the area. Median and average prices are for homes that sold in the month. Figures can be revised.
Own a home in this neighbourhood?
See what it is worth today. Get your own Owner Console from Jeff and Shirley Mikolajow: a home value update by email every month, with nearby listings in your area. Free, no obligation.
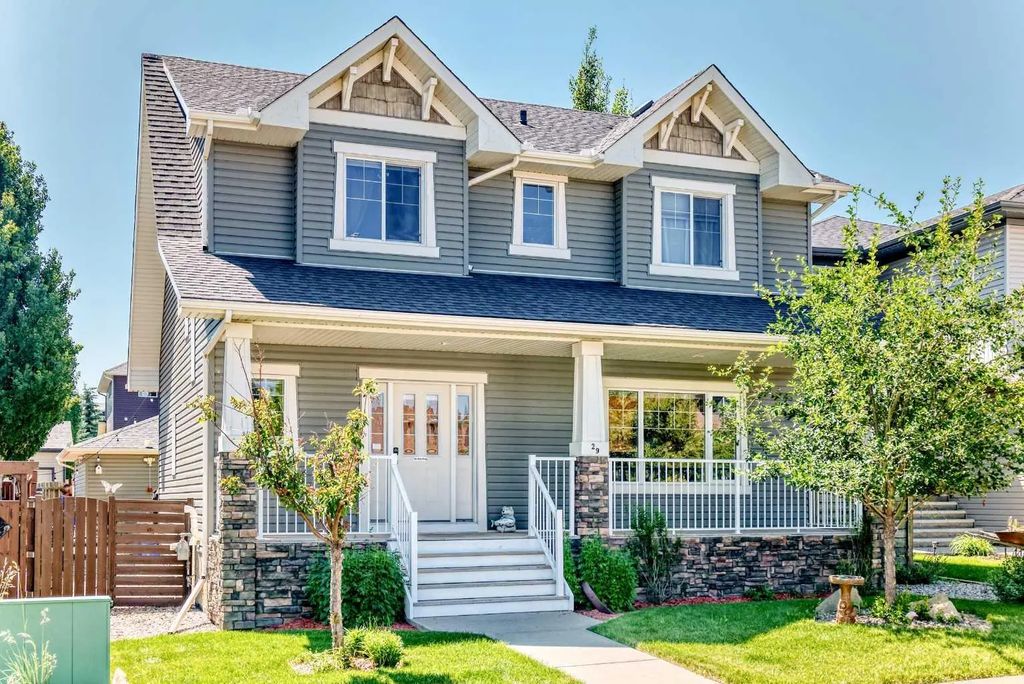
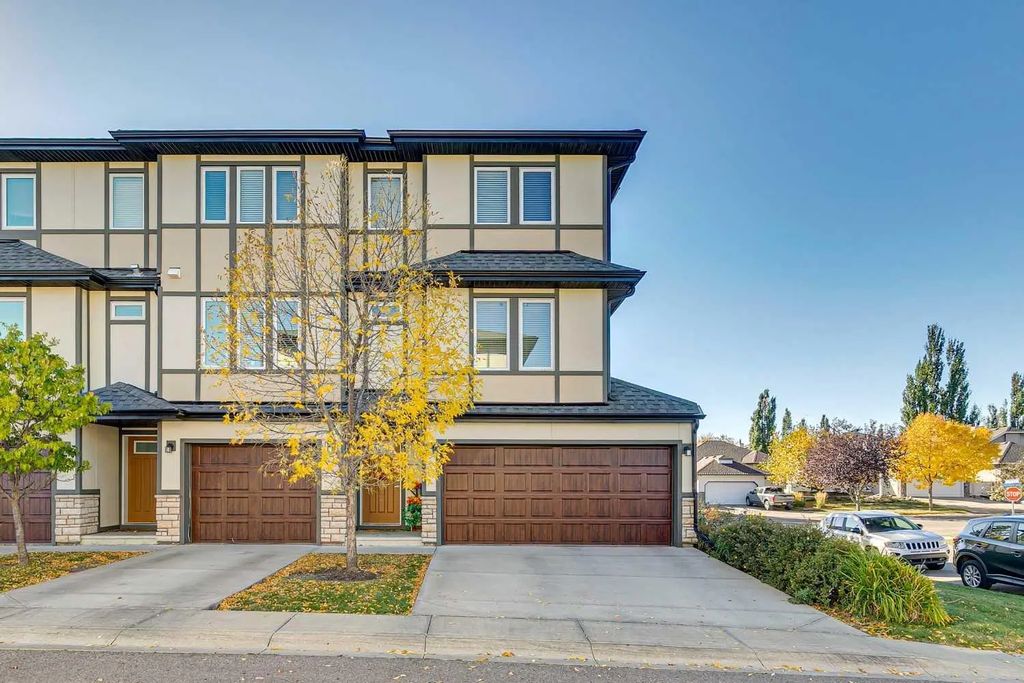
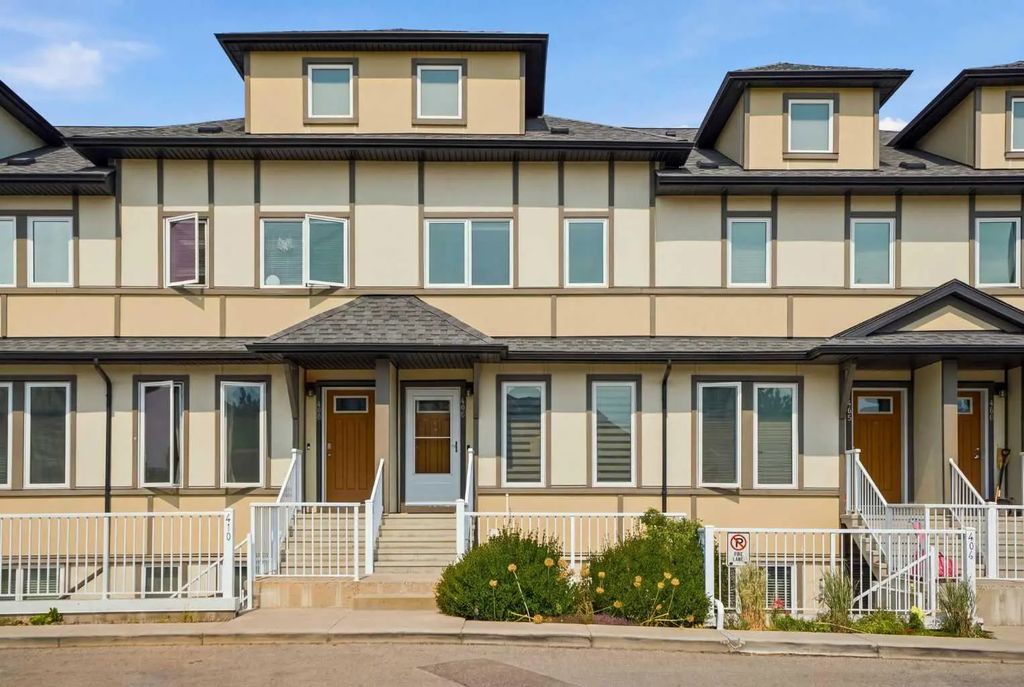
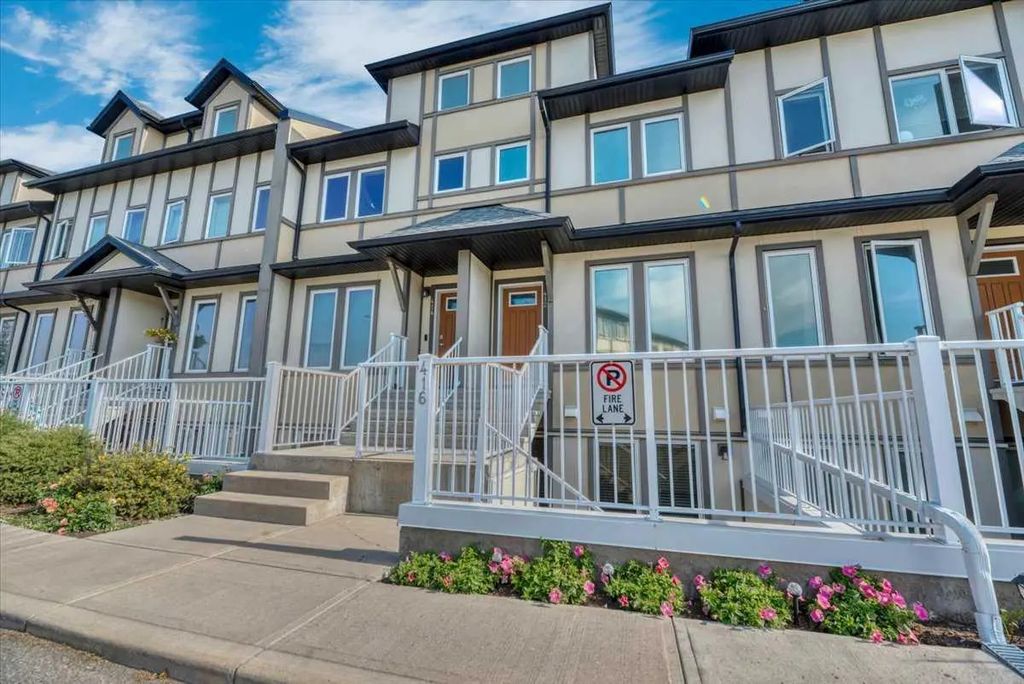
Track My Home's ValueWestridge is an established southwest Okotoks community that took shape mainly between the early 1990s and early 2000s, giving it a genuine mix of original-owner homes and newer resales among mature, tree-lined streets. Housing styles range widely, from two-storey single-family homes and bungalows to stacked townhouse condos and a cluster of colourful five-level split condos that longtime residents affectionately call Legoland. The community is built around a roughly three-acre central park, and residents are within walking distance of the Pason Centennial Arena, the Seniors Centre, and the Foothills Centennial Centre. Westridge sits just north of Westmount, with convenient access to Highway 7, downtown boutiques, and big-box shopping.
Search Westridge Okotoks Real Estate Listings - Homes, Condos and Townhouses For Sale
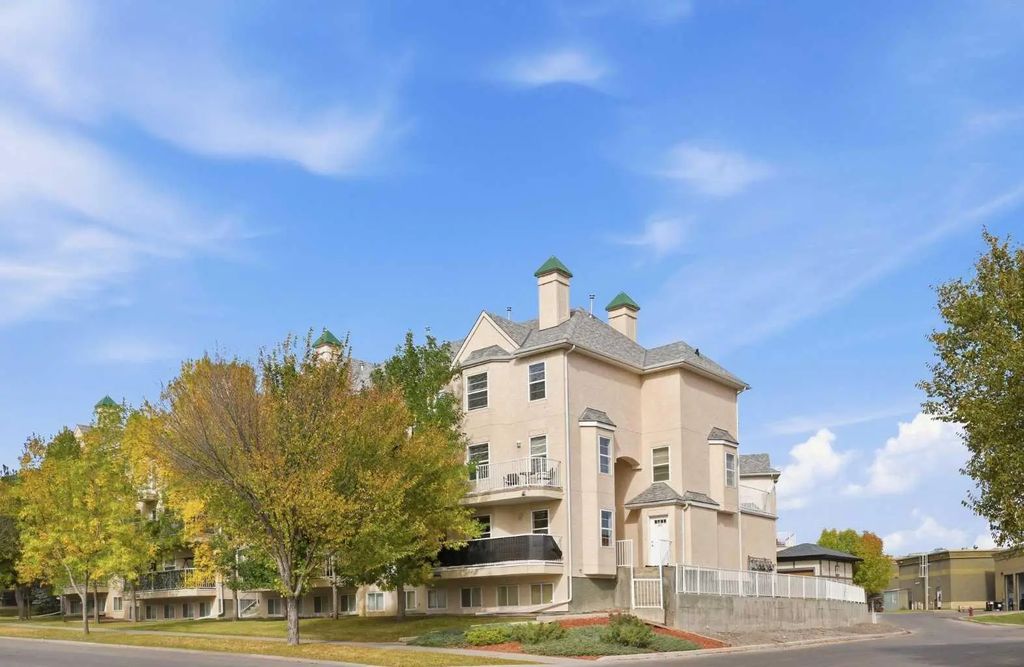

Frequently Asked Questions About Westridge
When were homes in Westridge built?
Mostly between the early 1990s and 2002, according to area real estate sources, giving the community a mix of original-owner homes and updated resales.
What's the "Legoland" nickname about?
It refers to a cluster of brightly coloured, five-level split condos in Westridge that longtime locals gave the affectionate nickname.
What schools serve Westridge?
Westmount School and St. Mary's School for elementary, John Paul II Collegiate for junior high, and Foothills Composite High School or Holy Trinity Academy for high school.
I’m a homeowner in Okotoks. What’s the best way to track my home’s value?
The easiest way is a free Owner Console from Jeff and Shirley Mikolajow. You get a home value update by email every month, plus nearby listings in Okotoks, with no cost or obligation. Get your free Owner Console.