
Wedderburn Okotoks MLS® Listings
Okotoks Market Snapshot
Wedderburn is part of Okotoks. CREB reports statistics for Okotoks, so this snapshot shows Okotoks.
September 2026 · all residential property types
In September 2026, the benchmark price for Okotoks was $606,800, up 0.1% from September last year. 56 homes sold (up 10%), 74 new listings came on the market (up 7%), and there were 121 active listings at month end (up 5%). Among homes that sold, the median sale price was $622,500 (up 3.8%) and the average sale price was $642,130 (up 0.3%), and homes sold for 98.0% of their asking price. That is 2.2 months of supply, and homes spent 45 days on the market (up 9 days). Figures cover all residential property types.
View the numbers
| Measure | September 2026 | September last year |
|---|---|---|
| Benchmark price | $606,800 | $605,900 |
| Median price | $622,500 | $599,900 |
| Average price | $642,130 | $640,369 |
| Sold vs asking | 98.0% | 98.0% |
| Homes sold | 56 | 51 |
| New listings | 74 | 69 |
| Active listings | 121 | 115 |
| Months of supply | 2.2 | 2.3 |
| Days on market | 45 | 36 |
ShowHide 12-month trend
View the monthly numbers
| Month | Benchmark price | Sold | New listings | Active listings | Months of supply | Days on market | Median price | Average price | Sold vs asking |
|---|---|---|---|---|---|---|---|---|---|
| Oct 2025 | $620,500 | 45 | 91 | 137 | 3.0 | 46 | $669,900 | $643,549 | 98.0% |
| Nov 2025 | $598,700 | 51 | 56 | 110 | 2.2 | 39 | $588,000 | $578,440 | 98.0% |
| Dec 2025 | $600,000 | 26 | 20 | 74 | 2.9 | 45 | $647,238 | $689,679 | 98.0% |
| Jan 2026 | $599,500 | 33 | 52 | 79 | 2.4 | 52 | $610,000 | $623,418 | 98.0% |
| Feb 2026 | $612,300 | 36 | 63 | 96 | 2.7 | 41 | $595,750 | $676,603 | 98.0% |
| Mar 2026 | $618,100 | 52 | 94 | 117 | 2.3 | 37 | $651,000 | $652,042 | 98.0% |
| Apr 2026 | $627,600 | 58 | 113 | 149 | 2.6 | 26 | $712,500 | $723,481 | 98.0% |
| May 2026 | $618,900 | 71 | 121 | 177 | 2.5 | 30 | $681,500 | $699,665 | 98.0% |
| Jun 2026 | $618,600 | 70 | 89 | 164 | 2.3 | 35 | $638,500 | $676,620 | 98.0% |
| Jul 2026 | $617,900 | 70 | 78 | 141 | 2.0 | 41 | $582,000 | $609,964 | 98.0% |
| Aug 2026 | $608,400 | 55 | 68 | 133 | 2.4 | 50 | $635,000 | $628,004 | 98.0% |
| Sep 2026 | $606,800 | 56 | 74 | 121 | 2.2 | 45 | $622,500 | $642,130 | 98.0% |
September 2026 · detached homes
In September 2026, the benchmark price for Okotoks was $680,900, down 0.4% from September last year. 40 homes sold (up 5%), 54 new listings came on the market (up 6%), and there were 78 active listings at month end (up 3%). Among homes that sold, the median sale price was $706,000 (up 4.8%) and the average sale price was $723,783 (up 0.2%), and homes sold for 98.0% of their asking price. That is 2.0 months of supply, and homes spent 48 days on the market (up 11 days). Figures cover detached homes.
View the numbers
| Measure | September 2026 | September last year |
|---|---|---|
| Benchmark price | $680,900 | $683,500 |
| Median price | $706,000 | $673,450 |
| Average price | $723,783 | $722,577 |
| Sold vs asking | 98.0% | 99.0% |
| Homes sold | 40 | 38 |
| New listings | 54 | 51 |
| Active listings | 78 | 76 |
| Months of supply | 2.0 | 2.0 |
| Days on market | 48 | 37 |
ShowHide 12-month trend
View the monthly numbers
| Month | Benchmark price | Sold | New listings | Active listings | Months of supply | Days on market | Median price | Average price | Sold vs asking |
|---|---|---|---|---|---|---|---|---|---|
| Oct 2025 | $702,400 | 29 | 56 | 88 | 3.0 | 34 | $715,000 | $757,410 | 98.0% |
| Nov 2025 | $676,300 | 32 | 36 | 72 | 2.3 | 42 | $616,000 | $683,791 | 98.0% |
| Dec 2025 | $679,200 | 18 | 14 | 44 | 2.4 | 47 | $704,750 | $765,072 | 98.0% |
| Jan 2026 | $679,000 | 23 | 36 | 48 | 2.1 | 46 | $670,000 | $717,630 | 98.0% |
| Feb 2026 | $699,900 | 22 | 45 | 65 | 3.0 | 41 | $738,500 | $837,859 | 98.0% |
| Mar 2026 | $701,600 | 34 | 73 | 89 | 2.6 | 36 | $702,500 | $720,115 | 98.0% |
| Apr 2026 | $709,300 | 46 | 76 | 100 | 2.2 | 26 | $752,500 | $801,041 | 98.0% |
| May 2026 | $698,200 | 52 | 81 | 113 | 2.2 | 26 | $740,000 | $784,687 | 98.0% |
| Jun 2026 | $695,300 | 52 | 63 | 106 | 2.0 | 39 | $695,750 | $745,488 | 98.0% |
| Jul 2026 | $695,700 | 48 | 60 | 95 | 2.0 | 40 | $633,660 | $708,749 | 98.0% |
| Aug 2026 | $685,800 | 37 | 39 | 84 | 2.3 | 48 | $709,500 | $712,670 | 98.0% |
| Sep 2026 | $680,900 | 40 | 54 | 78 | 2.0 | 48 | $706,000 | $723,783 | 98.0% |
September 2026 · semi-detached homes
In September 2026, the benchmark price for Okotoks was $566,100, down 2.7% from September last year. 7 homes sold (up 250%), 6 new listings came on the market (up 20%), and there were 8 active listings at month end (down 20%). Among homes that sold, the median sale price was $520,000 (down 2.0%) and the average sale price was $533,768 (up 0.6%), and homes sold for 99.0% of their asking price. That is 1.1 months of supply, and homes spent 34 days on the market (up 6 days). Figures cover semi-detached homes.
View the numbers
| Measure | September 2026 | September last year |
|---|---|---|
| Benchmark price | $566,100 | $581,600 |
| Median price | $520,000 | $530,500 |
| Average price | $533,768 | $530,500 |
| Sold vs asking | 99.0% | 99.0% |
| Homes sold | 7 | 2 |
| New listings | 6 | 5 |
| Active listings | 8 | 10 |
| Months of supply | 1.1 | 5.0 |
| Days on market | 34 | 28 |
ShowHide 12-month trend
View the monthly numbers
| Month | Benchmark price | Sold | New listings | Active listings | Months of supply | Days on market | Median price | Average price | Sold vs asking |
|---|---|---|---|---|---|---|---|---|---|
| Oct 2025 | $584,100 | 6 | 9 | 12 | 2.0 | 89 | $613,750 | $618,050 | 99.0% |
| Nov 2025 | $565,600 | 4 | 8 | 10 | 2.5 | 32 | $608,500 | $620,500 | 97.0% |
| Dec 2025 | $557,700 | 4 | 2 | 8 | 2.0 | 27 | $554,500 | $547,094 | 98.0% |
| Jan 2026 | $551,000 | 3 | 3 | 8 | 2.7 | 75 | $515,000 | $536,333 | 98.0% |
| Feb 2026 | $553,600 | 3 | 11 | 16 | 5.3 | 23 | $630,000 | $629,633 | 99.0% |
| Mar 2026 | $583,400 | 8 | 4 | 8 | 1.0 | 43 | $699,900 | $674,162 | 100.0% |
| Apr 2026 | $596,700 | 2 | 13 | 17 | 8.5 | 23 | $725,500 | $725,500 | 100.0% |
| May 2026 | $581,200 | 6 | 12 | 21 | 3.5 | 68 | $540,000 | $545,650 | 99.0% |
| Jun 2026 | $588,900 | 7 | 5 | 13 | 1.9 | 21 | $575,000 | $591,571 | 98.0% |
| Jul 2026 | $580,600 | 4 | 6 | 12 | 3.0 | 23 | $505,500 | $515,250 | 98.0% |
| Aug 2026 | $565,900 | 8 | 11 | 12 | 1.5 | 52 | $534,500 | $556,612 | 98.0% |
| Sep 2026 | $566,100 | 7 | 6 | 8 | 1.1 | 34 | $520,000 | $533,768 | 99.0% |
September 2026 · row and townhouse homes
In September 2026, the benchmark price for Okotoks was $463,300, down 2.5% from September last year. 3 homes sold (down 50%), 8 new listings came on the market (up 167%), and there were 19 active listings at month end (up 36%). Among homes that sold, the median sale price was $322,200 (down 24.0%) and the average sale price was $340,733 (down 20.4%), and homes sold for 98.0% of their asking price. That is 6.3 months of supply, and homes spent 34 days on the market (down 3 days). Figures cover row and townhouse homes.
View the numbers
| Measure | September 2026 | September last year |
|---|---|---|
| Benchmark price | $463,300 | $475,400 |
| Median price | $322,200 | $424,000 |
| Average price | $340,733 | $428,317 |
| Sold vs asking | 98.0% | 99.0% |
| Homes sold | 3 | 6 |
| New listings | 8 | 3 |
| Active listings | 19 | 14 |
| Months of supply | 6.3 | 2.3 |
| Days on market | 34 | 37 |
ShowHide 12-month trend
View the monthly numbers
| Month | Benchmark price | Sold | New listings | Active listings | Months of supply | Days on market | Median price | Average price | Sold vs asking |
|---|---|---|---|---|---|---|---|---|---|
| Oct 2025 | $473,700 | 3 | 12 | 19 | 6.3 | 74 | $415,000 | $390,000 | 97.0% |
| Nov 2025 | $459,400 | 7 | 4 | 11 | 1.6 | 45 | $360,000 | $379,500 | 97.0% |
| Dec 2025 | $456,500 | 4 | 1 | 7 | 1.8 | 58 | $502,500 | $493,000 | 98.0% |
| Jan 2026 | $449,500 | 1 | 5 | 10 | 10.0 | 103 | $396,000 | $396,000 | 97.0% |
| Feb 2026 | $443,700 | 4 | 3 | 7 | 1.8 | 18 | $393,000 | $391,000 | 99.0% |
| Mar 2026 | $471,900 | 5 | 7 | 7 | 1.4 | 56 | $449,500 | $467,800 | 98.0% |
| Apr 2026 | $496,000 | 3 | 12 | 15 | 5.0 | 13 | $571,100 | $481,033 | 98.0% |
| May 2026 | $476,600 | 9 | 18 | 22 | 2.4 | 23 | $435,000 | $478,839 | 99.0% |
| Jun 2026 | $483,600 | 8 | 13 | 24 | 3.0 | 20 | $420,000 | $464,250 | 99.0% |
| Jul 2026 | $473,300 | 7 | 6 | 19 | 2.7 | 33 | $420,000 | $450,071 | 97.0% |
| Aug 2026 | $465,200 | 4 | 5 | 17 | 4.3 | 59 | $500,000 | $491,250 | 98.0% |
| Sep 2026 | $463,300 | 3 | 8 | 19 | 6.3 | 34 | $322,200 | $340,733 | 98.0% |
September 2026 · apartment condos
In September 2026, the benchmark price for Okotoks was $290,300, up 5.6% from September last year. 6 homes sold (up 20%), 6 new listings came on the market (down 40%), and there were 16 active listings at month end (up 7%). Among homes that sold, the median sale price was $355,000 (up 7.6%) and the average sale price was $374,900 (up 19.4%), and homes sold for 98.0% of their asking price. That is 2.7 months of supply, and homes spent 40 days on the market (up 1 days). Figures cover apartment condos.
View the numbers
| Measure | September 2026 | September last year |
|---|---|---|
| Benchmark price | $290,300 | $274,900 |
| Median price | $355,000 | $330,000 |
| Average price | $374,900 | $314,000 |
| Sold vs asking | 98.0% | 96.0% |
| Homes sold | 6 | 5 |
| New listings | 6 | 10 |
| Active listings | 16 | 15 |
| Months of supply | 2.7 | 3.0 |
| Days on market | 40 | 39 |
ShowHide 12-month trend
View the monthly numbers
| Month | Benchmark price | Sold | New listings | Active listings | Months of supply | Days on market | Median price | Average price | Sold vs asking |
|---|---|---|---|---|---|---|---|---|---|
| Oct 2025 | $281,500 | 7 | 14 | 18 | 2.6 | 48 | $280,000 | $302,357 | 97.0% |
| Nov 2025 | $278,900 | 8 | 8 | 17 | 2.1 | 27 | $314,500 | $310,081 | 99.0% |
| Dec 2025 | $273,400 | 0 | 3 | 15 | n/a | n/a | n/a | n/a | n/a |
| Jan 2026 | $273,600 | 6 | 8 | 13 | 2.2 | 58 | $345,000 | $343,717 | 98.0% |
| Feb 2026 | $266,800 | 7 | 4 | 8 | 1.1 | 61 | $345,000 | $353,129 | 98.0% |
| Mar 2026 | $279,400 | 5 | 10 | 13 | 2.6 | 21 | $322,000 | $338,000 | 96.0% |
| Apr 2026 | $282,300 | 7 | 12 | 17 | 2.4 | 33 | $289,900 | $317,129 | 98.0% |
| May 2026 | $295,600 | 4 | 10 | 21 | 5.3 | 38 | $336,050 | $322,275 | 99.0% |
| Jun 2026 | $291,300 | 3 | 8 | 21 | 7.0 | 38 | $250,000 | $247,667 | 96.0% |
| Jul 2026 | $292,800 | 11 | 6 | 15 | 1.4 | 58 | $315,000 | $315,091 | 98.0% |
| Aug 2026 | $284,700 | 6 | 13 | 20 | 3.3 | 55 | $294,750 | $292,250 | 97.0% |
| Sep 2026 | $290,300 | 6 | 6 | 16 | 2.7 | 40 | $355,000 | $374,900 | 98.0% |
Source: Calgary Real Estate Board (CREB®) monthly statistics. Benchmark price is the typical price of a home in the area. Median and average prices are for homes that sold in the month. Figures can be revised.
Own a home in this neighbourhood?
See what it is worth today. Get your own Owner Console from Jeff and Shirley Mikolajow: a home value update by email every month, with nearby listings in your area. Free, no obligation.
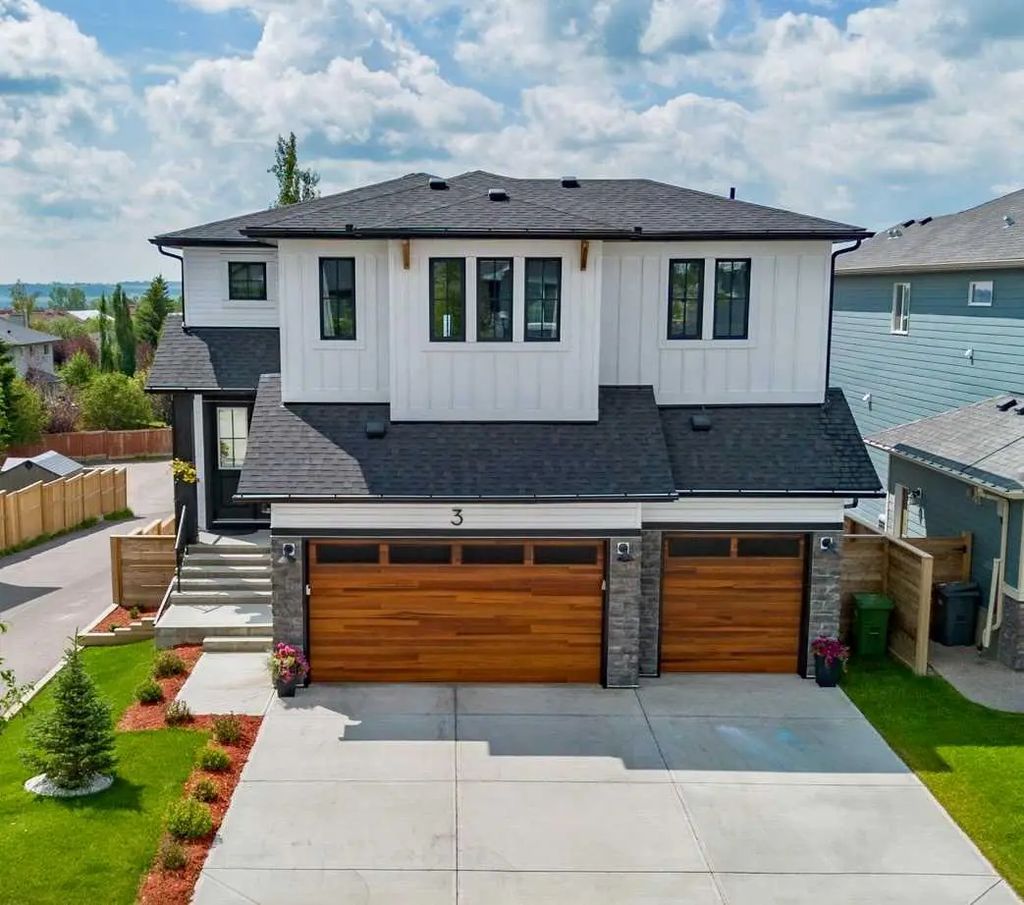
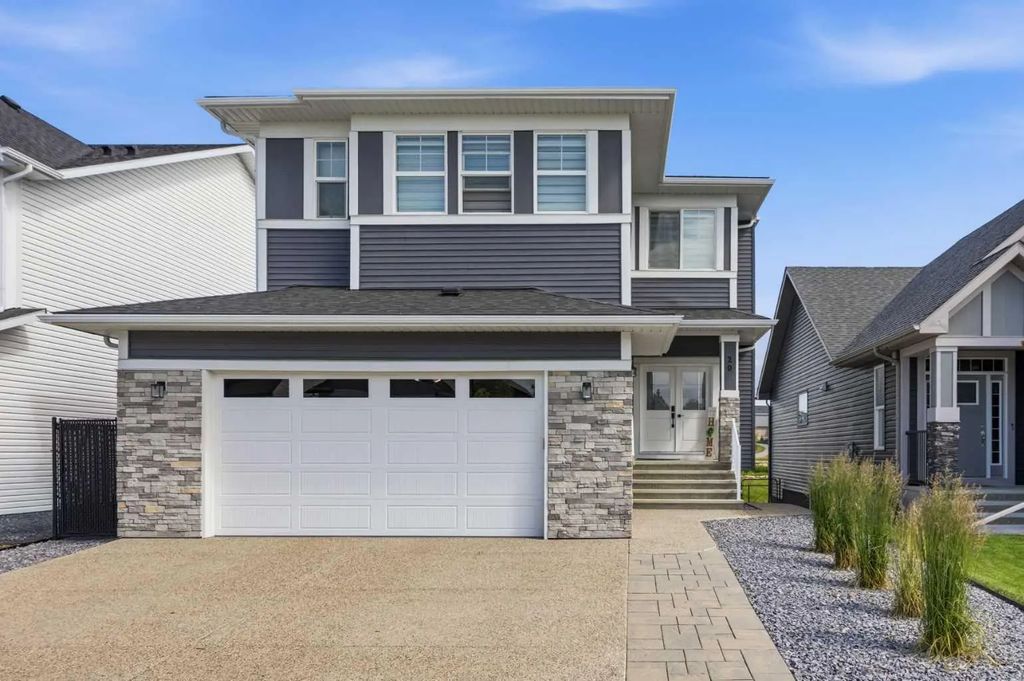
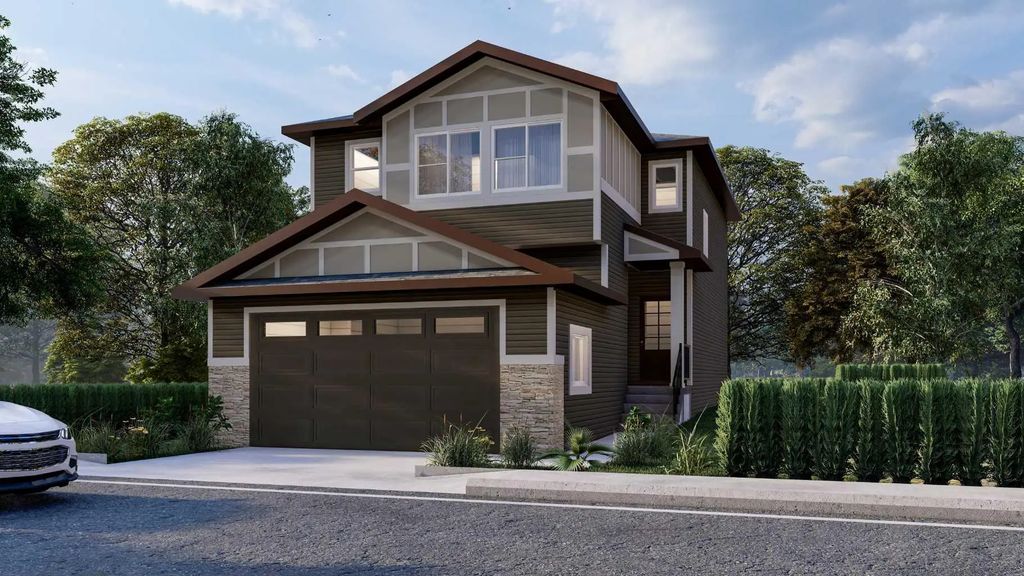
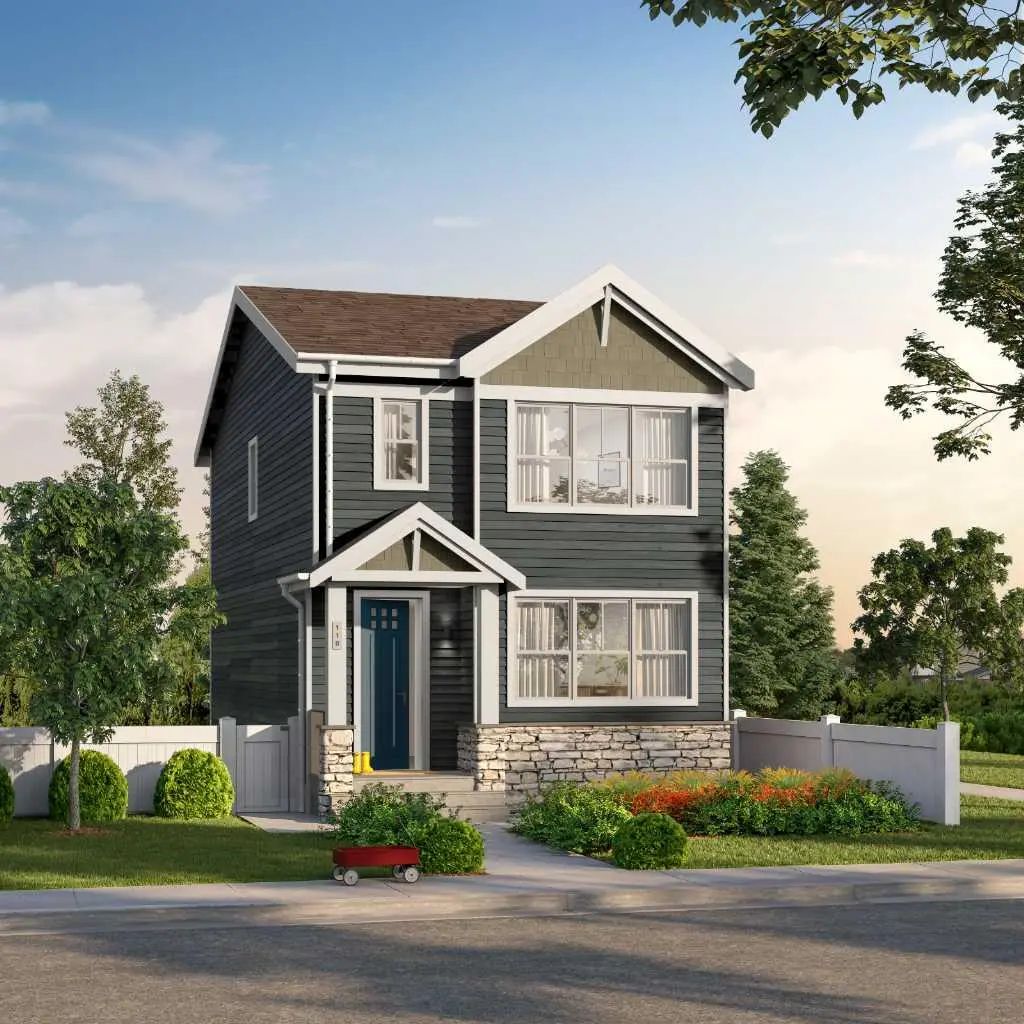
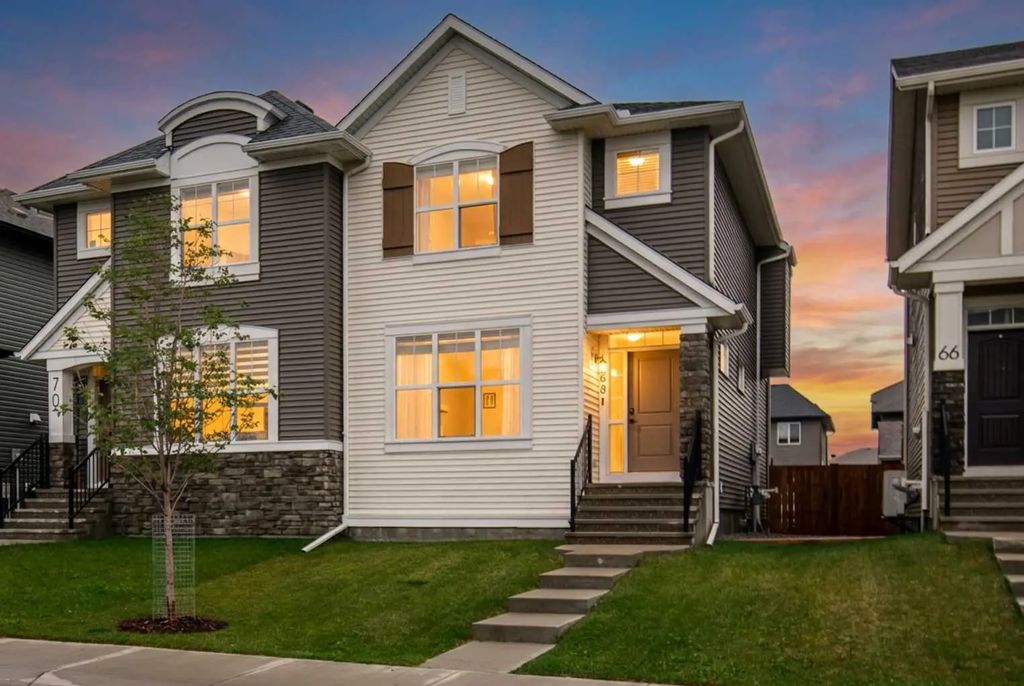
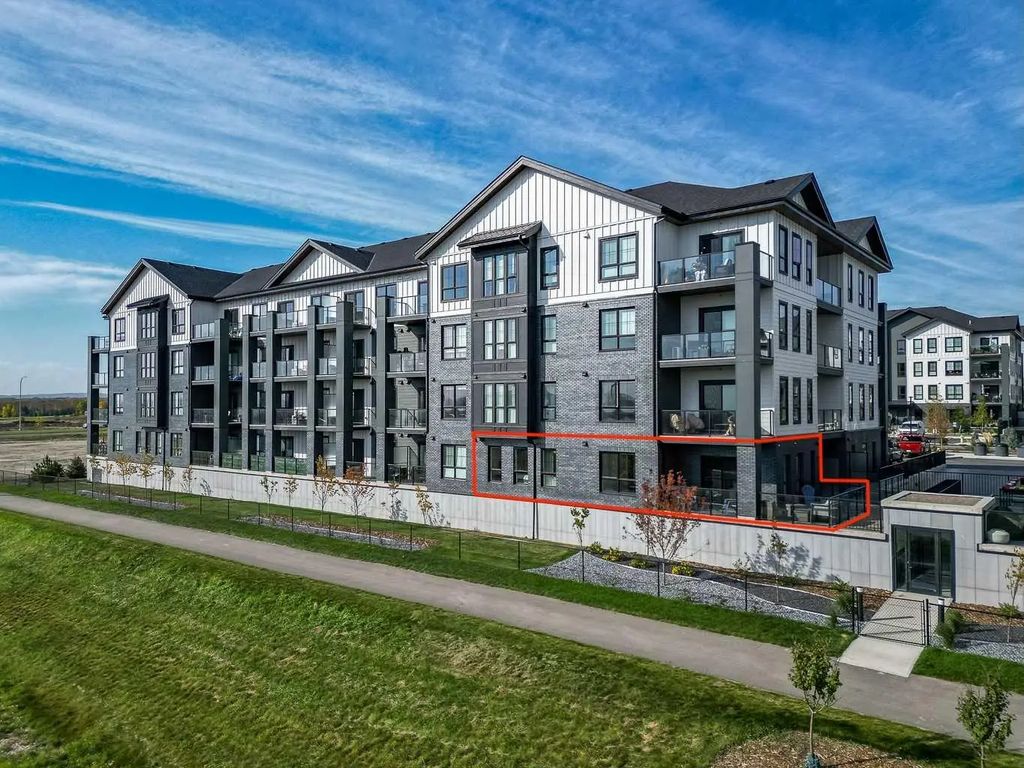
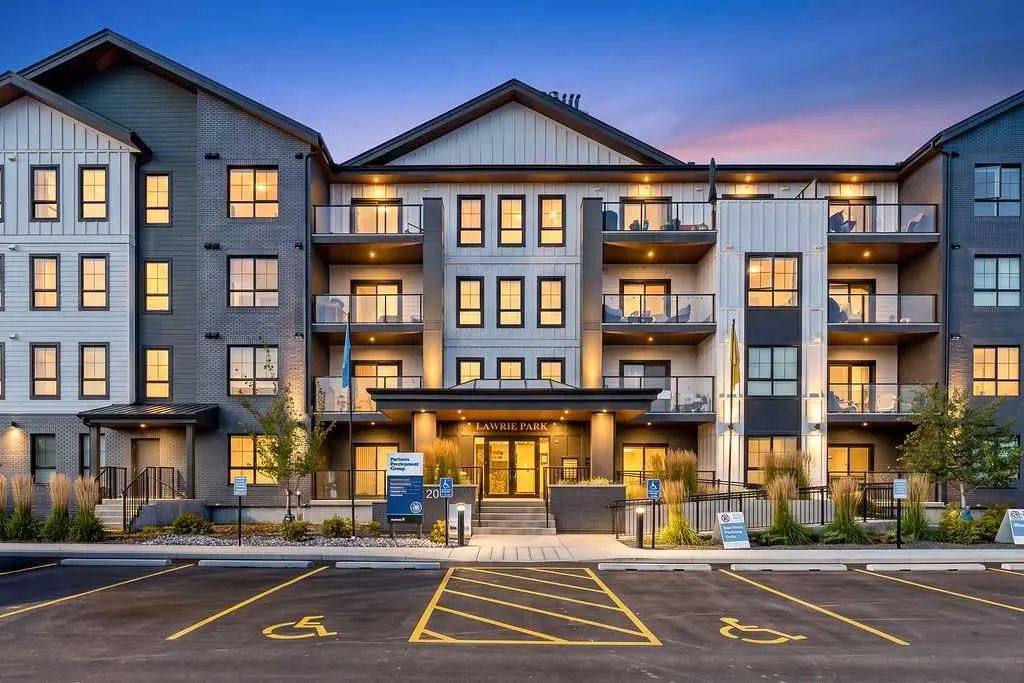
Track My Home's ValueWedderburn is Okotoks' newest master-planned community, developed by Anthem Properties in the town's north end alongside neighbouring D'Arcy, just south of D'Arcy Ranch Golf Club. First introduced to the market around 2021 with builders including Anthem, Partners Development Group, Prominent Homes and Sterling Homes, Wedderburn was designed around walkability, with pathways linking homes to playgrounds, a natural pond and green space, and to Meadow Ridge School (kindergarten to grade 9) just east of the community. Its north Okotoks location is a deliberate draw for Calgary commuters, with roughly a 15-minute drive via Macleod Trail, Deerfoot Trail and Stoney Trail to south Calgary and the airport. Shopping and dining are close at hand at D'Arcy Crossing and D'Arcy Ranch's public golf course.
Search Wedderburn Okotoks Real Estate Listings - Homes, Condos and Townhouses For Sale





Frequently Asked Questions About Wedderburn
How far is Wedderburn from Calgary?
About a 15-minute drive via Macleod Trail, Deerfoot Trail and Stoney Trail to south Calgary, making it a popular choice for Calgary commuters.
Who built homes in Wedderburn?
Anthem Properties Group is the developer, with builders including Anthem, Partners Development Group, Prominent Homes and Sterling Homes bringing homes to market starting around 2021.
What schools serve Wedderburn?
Meadow Ridge School (kindergarten to grade 9) sits just east of the community, connected by the neighbourhood's pathway network so kids can walk or bike to campus.
I’m a homeowner in Okotoks. What’s the best way to track my home’s value?
The easiest way is a free Owner Console from Jeff and Shirley Mikolajow. You get a home value update by email every month, plus nearby listings in Okotoks, with no cost or obligation. Get your free Owner Console.