
Sandstone Okotoks MLS® Listings
Okotoks Market Snapshot
Sandstone is part of Okotoks. CREB reports statistics for Okotoks, so this snapshot shows Okotoks.
September 2026 · all residential property types
In September 2026, the benchmark price for Okotoks was $606,800, up 0.1% from September last year. 56 homes sold (up 10%), 74 new listings came on the market (up 7%), and there were 121 active listings at month end (up 5%). Among homes that sold, the median sale price was $622,500 (up 3.8%) and the average sale price was $642,130 (up 0.3%), and homes sold for 98.0% of their asking price. That is 2.2 months of supply, and homes spent 45 days on the market (up 9 days). Figures cover all residential property types.
View the numbers
| Measure | September 2026 | September last year |
|---|---|---|
| Benchmark price | $606,800 | $605,900 |
| Median price | $622,500 | $599,900 |
| Average price | $642,130 | $640,369 |
| Sold vs asking | 98.0% | 98.0% |
| Homes sold | 56 | 51 |
| New listings | 74 | 69 |
| Active listings | 121 | 115 |
| Months of supply | 2.2 | 2.3 |
| Days on market | 45 | 36 |
ShowHide 12-month trend
View the monthly numbers
| Month | Benchmark price | Sold | New listings | Active listings | Months of supply | Days on market | Median price | Average price | Sold vs asking |
|---|---|---|---|---|---|---|---|---|---|
| Oct 2025 | $620,500 | 45 | 91 | 137 | 3.0 | 46 | $669,900 | $643,549 | 98.0% |
| Nov 2025 | $598,700 | 51 | 56 | 110 | 2.2 | 39 | $588,000 | $578,440 | 98.0% |
| Dec 2025 | $600,000 | 26 | 20 | 74 | 2.9 | 45 | $647,238 | $689,679 | 98.0% |
| Jan 2026 | $599,500 | 33 | 52 | 79 | 2.4 | 52 | $610,000 | $623,418 | 98.0% |
| Feb 2026 | $612,300 | 36 | 63 | 96 | 2.7 | 41 | $595,750 | $676,603 | 98.0% |
| Mar 2026 | $618,100 | 52 | 94 | 117 | 2.3 | 37 | $651,000 | $652,042 | 98.0% |
| Apr 2026 | $627,600 | 58 | 113 | 149 | 2.6 | 26 | $712,500 | $723,481 | 98.0% |
| May 2026 | $618,900 | 71 | 121 | 177 | 2.5 | 30 | $681,500 | $699,665 | 98.0% |
| Jun 2026 | $618,600 | 70 | 89 | 164 | 2.3 | 35 | $638,500 | $676,620 | 98.0% |
| Jul 2026 | $617,900 | 70 | 78 | 141 | 2.0 | 41 | $582,000 | $609,964 | 98.0% |
| Aug 2026 | $608,400 | 55 | 68 | 133 | 2.4 | 50 | $635,000 | $628,004 | 98.0% |
| Sep 2026 | $606,800 | 56 | 74 | 121 | 2.2 | 45 | $622,500 | $642,130 | 98.0% |
September 2026 · detached homes
In September 2026, the benchmark price for Okotoks was $680,900, down 0.4% from September last year. 40 homes sold (up 5%), 54 new listings came on the market (up 6%), and there were 78 active listings at month end (up 3%). Among homes that sold, the median sale price was $706,000 (up 4.8%) and the average sale price was $723,783 (up 0.2%), and homes sold for 98.0% of their asking price. That is 2.0 months of supply, and homes spent 48 days on the market (up 11 days). Figures cover detached homes.
View the numbers
| Measure | September 2026 | September last year |
|---|---|---|
| Benchmark price | $680,900 | $683,500 |
| Median price | $706,000 | $673,450 |
| Average price | $723,783 | $722,577 |
| Sold vs asking | 98.0% | 99.0% |
| Homes sold | 40 | 38 |
| New listings | 54 | 51 |
| Active listings | 78 | 76 |
| Months of supply | 2.0 | 2.0 |
| Days on market | 48 | 37 |
ShowHide 12-month trend
View the monthly numbers
| Month | Benchmark price | Sold | New listings | Active listings | Months of supply | Days on market | Median price | Average price | Sold vs asking |
|---|---|---|---|---|---|---|---|---|---|
| Oct 2025 | $702,400 | 29 | 56 | 88 | 3.0 | 34 | $715,000 | $757,410 | 98.0% |
| Nov 2025 | $676,300 | 32 | 36 | 72 | 2.3 | 42 | $616,000 | $683,791 | 98.0% |
| Dec 2025 | $679,200 | 18 | 14 | 44 | 2.4 | 47 | $704,750 | $765,072 | 98.0% |
| Jan 2026 | $679,000 | 23 | 36 | 48 | 2.1 | 46 | $670,000 | $717,630 | 98.0% |
| Feb 2026 | $699,900 | 22 | 45 | 65 | 3.0 | 41 | $738,500 | $837,859 | 98.0% |
| Mar 2026 | $701,600 | 34 | 73 | 89 | 2.6 | 36 | $702,500 | $720,115 | 98.0% |
| Apr 2026 | $709,300 | 46 | 76 | 100 | 2.2 | 26 | $752,500 | $801,041 | 98.0% |
| May 2026 | $698,200 | 52 | 81 | 113 | 2.2 | 26 | $740,000 | $784,687 | 98.0% |
| Jun 2026 | $695,300 | 52 | 63 | 106 | 2.0 | 39 | $695,750 | $745,488 | 98.0% |
| Jul 2026 | $695,700 | 48 | 60 | 95 | 2.0 | 40 | $633,660 | $708,749 | 98.0% |
| Aug 2026 | $685,800 | 37 | 39 | 84 | 2.3 | 48 | $709,500 | $712,670 | 98.0% |
| Sep 2026 | $680,900 | 40 | 54 | 78 | 2.0 | 48 | $706,000 | $723,783 | 98.0% |
September 2026 · semi-detached homes
In September 2026, the benchmark price for Okotoks was $566,100, down 2.7% from September last year. 7 homes sold (up 250%), 6 new listings came on the market (up 20%), and there were 8 active listings at month end (down 20%). Among homes that sold, the median sale price was $520,000 (down 2.0%) and the average sale price was $533,768 (up 0.6%), and homes sold for 99.0% of their asking price. That is 1.1 months of supply, and homes spent 34 days on the market (up 6 days). Figures cover semi-detached homes.
View the numbers
| Measure | September 2026 | September last year |
|---|---|---|
| Benchmark price | $566,100 | $581,600 |
| Median price | $520,000 | $530,500 |
| Average price | $533,768 | $530,500 |
| Sold vs asking | 99.0% | 99.0% |
| Homes sold | 7 | 2 |
| New listings | 6 | 5 |
| Active listings | 8 | 10 |
| Months of supply | 1.1 | 5.0 |
| Days on market | 34 | 28 |
ShowHide 12-month trend
View the monthly numbers
| Month | Benchmark price | Sold | New listings | Active listings | Months of supply | Days on market | Median price | Average price | Sold vs asking |
|---|---|---|---|---|---|---|---|---|---|
| Oct 2025 | $584,100 | 6 | 9 | 12 | 2.0 | 89 | $613,750 | $618,050 | 99.0% |
| Nov 2025 | $565,600 | 4 | 8 | 10 | 2.5 | 32 | $608,500 | $620,500 | 97.0% |
| Dec 2025 | $557,700 | 4 | 2 | 8 | 2.0 | 27 | $554,500 | $547,094 | 98.0% |
| Jan 2026 | $551,000 | 3 | 3 | 8 | 2.7 | 75 | $515,000 | $536,333 | 98.0% |
| Feb 2026 | $553,600 | 3 | 11 | 16 | 5.3 | 23 | $630,000 | $629,633 | 99.0% |
| Mar 2026 | $583,400 | 8 | 4 | 8 | 1.0 | 43 | $699,900 | $674,162 | 100.0% |
| Apr 2026 | $596,700 | 2 | 13 | 17 | 8.5 | 23 | $725,500 | $725,500 | 100.0% |
| May 2026 | $581,200 | 6 | 12 | 21 | 3.5 | 68 | $540,000 | $545,650 | 99.0% |
| Jun 2026 | $588,900 | 7 | 5 | 13 | 1.9 | 21 | $575,000 | $591,571 | 98.0% |
| Jul 2026 | $580,600 | 4 | 6 | 12 | 3.0 | 23 | $505,500 | $515,250 | 98.0% |
| Aug 2026 | $565,900 | 8 | 11 | 12 | 1.5 | 52 | $534,500 | $556,612 | 98.0% |
| Sep 2026 | $566,100 | 7 | 6 | 8 | 1.1 | 34 | $520,000 | $533,768 | 99.0% |
September 2026 · row and townhouse homes
In September 2026, the benchmark price for Okotoks was $463,300, down 2.5% from September last year. 3 homes sold (down 50%), 8 new listings came on the market (up 167%), and there were 19 active listings at month end (up 36%). Among homes that sold, the median sale price was $322,200 (down 24.0%) and the average sale price was $340,733 (down 20.4%), and homes sold for 98.0% of their asking price. That is 6.3 months of supply, and homes spent 34 days on the market (down 3 days). Figures cover row and townhouse homes.
View the numbers
| Measure | September 2026 | September last year |
|---|---|---|
| Benchmark price | $463,300 | $475,400 |
| Median price | $322,200 | $424,000 |
| Average price | $340,733 | $428,317 |
| Sold vs asking | 98.0% | 99.0% |
| Homes sold | 3 | 6 |
| New listings | 8 | 3 |
| Active listings | 19 | 14 |
| Months of supply | 6.3 | 2.3 |
| Days on market | 34 | 37 |
ShowHide 12-month trend
View the monthly numbers
| Month | Benchmark price | Sold | New listings | Active listings | Months of supply | Days on market | Median price | Average price | Sold vs asking |
|---|---|---|---|---|---|---|---|---|---|
| Oct 2025 | $473,700 | 3 | 12 | 19 | 6.3 | 74 | $415,000 | $390,000 | 97.0% |
| Nov 2025 | $459,400 | 7 | 4 | 11 | 1.6 | 45 | $360,000 | $379,500 | 97.0% |
| Dec 2025 | $456,500 | 4 | 1 | 7 | 1.8 | 58 | $502,500 | $493,000 | 98.0% |
| Jan 2026 | $449,500 | 1 | 5 | 10 | 10.0 | 103 | $396,000 | $396,000 | 97.0% |
| Feb 2026 | $443,700 | 4 | 3 | 7 | 1.8 | 18 | $393,000 | $391,000 | 99.0% |
| Mar 2026 | $471,900 | 5 | 7 | 7 | 1.4 | 56 | $449,500 | $467,800 | 98.0% |
| Apr 2026 | $496,000 | 3 | 12 | 15 | 5.0 | 13 | $571,100 | $481,033 | 98.0% |
| May 2026 | $476,600 | 9 | 18 | 22 | 2.4 | 23 | $435,000 | $478,839 | 99.0% |
| Jun 2026 | $483,600 | 8 | 13 | 24 | 3.0 | 20 | $420,000 | $464,250 | 99.0% |
| Jul 2026 | $473,300 | 7 | 6 | 19 | 2.7 | 33 | $420,000 | $450,071 | 97.0% |
| Aug 2026 | $465,200 | 4 | 5 | 17 | 4.3 | 59 | $500,000 | $491,250 | 98.0% |
| Sep 2026 | $463,300 | 3 | 8 | 19 | 6.3 | 34 | $322,200 | $340,733 | 98.0% |
September 2026 · apartment condos
In September 2026, the benchmark price for Okotoks was $290,300, up 5.6% from September last year. 6 homes sold (up 20%), 6 new listings came on the market (down 40%), and there were 16 active listings at month end (up 7%). Among homes that sold, the median sale price was $355,000 (up 7.6%) and the average sale price was $374,900 (up 19.4%), and homes sold for 98.0% of their asking price. That is 2.7 months of supply, and homes spent 40 days on the market (up 1 days). Figures cover apartment condos.
View the numbers
| Measure | September 2026 | September last year |
|---|---|---|
| Benchmark price | $290,300 | $274,900 |
| Median price | $355,000 | $330,000 |
| Average price | $374,900 | $314,000 |
| Sold vs asking | 98.0% | 96.0% |
| Homes sold | 6 | 5 |
| New listings | 6 | 10 |
| Active listings | 16 | 15 |
| Months of supply | 2.7 | 3.0 |
| Days on market | 40 | 39 |
ShowHide 12-month trend
View the monthly numbers
| Month | Benchmark price | Sold | New listings | Active listings | Months of supply | Days on market | Median price | Average price | Sold vs asking |
|---|---|---|---|---|---|---|---|---|---|
| Oct 2025 | $281,500 | 7 | 14 | 18 | 2.6 | 48 | $280,000 | $302,357 | 97.0% |
| Nov 2025 | $278,900 | 8 | 8 | 17 | 2.1 | 27 | $314,500 | $310,081 | 99.0% |
| Dec 2025 | $273,400 | 0 | 3 | 15 | n/a | n/a | n/a | n/a | n/a |
| Jan 2026 | $273,600 | 6 | 8 | 13 | 2.2 | 58 | $345,000 | $343,717 | 98.0% |
| Feb 2026 | $266,800 | 7 | 4 | 8 | 1.1 | 61 | $345,000 | $353,129 | 98.0% |
| Mar 2026 | $279,400 | 5 | 10 | 13 | 2.6 | 21 | $322,000 | $338,000 | 96.0% |
| Apr 2026 | $282,300 | 7 | 12 | 17 | 2.4 | 33 | $289,900 | $317,129 | 98.0% |
| May 2026 | $295,600 | 4 | 10 | 21 | 5.3 | 38 | $336,050 | $322,275 | 99.0% |
| Jun 2026 | $291,300 | 3 | 8 | 21 | 7.0 | 38 | $250,000 | $247,667 | 96.0% |
| Jul 2026 | $292,800 | 11 | 6 | 15 | 1.4 | 58 | $315,000 | $315,091 | 98.0% |
| Aug 2026 | $284,700 | 6 | 13 | 20 | 3.3 | 55 | $294,750 | $292,250 | 97.0% |
| Sep 2026 | $290,300 | 6 | 6 | 16 | 2.7 | 40 | $355,000 | $374,900 | 98.0% |
Source: Calgary Real Estate Board (CREB®) monthly statistics. Benchmark price is the typical price of a home in the area. Median and average prices are for homes that sold in the month. Figures can be revised.
Own a home in this neighbourhood?
See what it is worth today. Get your own Owner Console from Jeff and Shirley Mikolajow: a home value update by email every month, with nearby listings in your area. Free, no obligation.
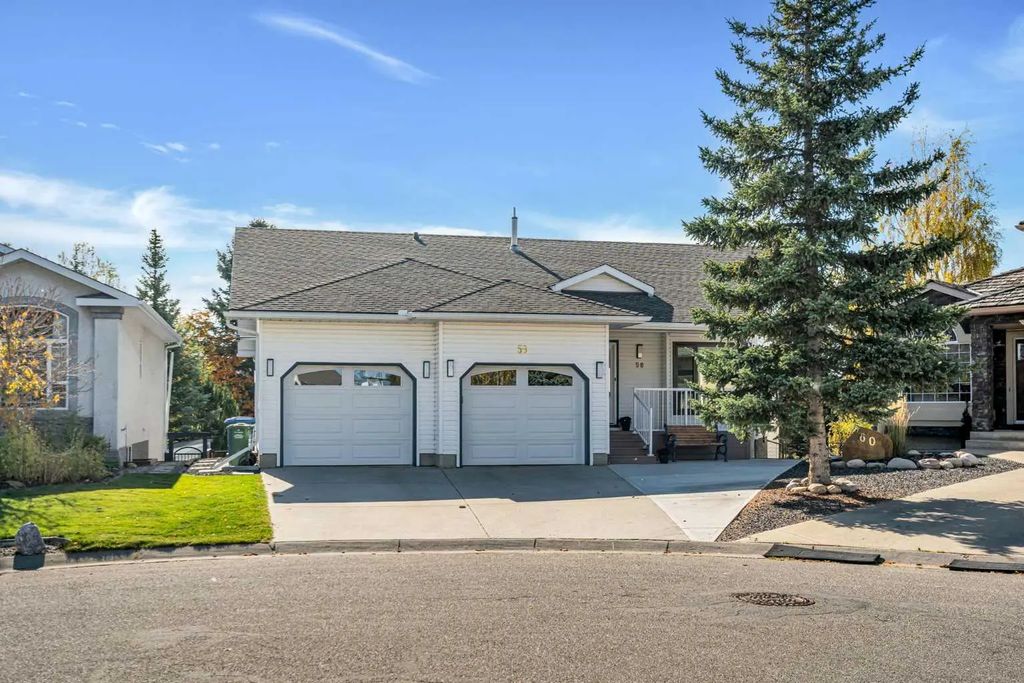
Track My Home's ValueSandstone sits at the northwest tip of Okotoks, Alberta, next to the community of Mountainview, which overlooks the Sheep River escarpment. This is the Okotoks Sandstone, unrelated to the Sandstone Valley community in northwest Calgary, a separate town. Development here began in the mid-1990s, and the neighbourhood is known for its quiet cul-de-sacs, villa bungalows, and single family homes, some with views toward the Rocky Mountains. A small retail node near the entrance includes a grocery store and gas station, while an extensive walking and biking pathway system connects Sandstone to downtown Okotoks. Families are served by Ecole Good Shepherd School and Big Rock School at the elementary level, with John Paul II Collegiate, Ecole Okotoks Junior High School, Holy Trinity Academy, and Foothills Composite High School serving older students.
Search Sandstone Okotoks Real Estate Listings - Homes, Condos and Townhouses For Sale
Frequently Asked Questions About Sandstone
Is Sandstone in Okotoks connected to Calgary's Sandstone Valley?
No, they are unrelated. Okotoks' Sandstone is a distinct neighbourhood at the northwest tip of Okotoks near Mountainview, while Sandstone Valley is a separate community in northwest Calgary.
When was Sandstone in Okotoks built?
Development in Sandstone began in the mid-1990s. The community has since matured into a quiet, established area with villa bungalows, larger bungalows, and two storey single family homes on generous lots.
What schools serve Sandstone families?
Elementary students typically attend Ecole Good Shepherd School or Big Rock School. Older students can attend John Paul II Collegiate or Ecole Okotoks Junior High School, followed by Holy Trinity Academy or Foothills Composite High School.
I’m a homeowner in Okotoks. What’s the best way to track my home’s value?
The easiest way is a free Owner Console from Jeff and Shirley Mikolajow. You get a home value update by email every month, plus nearby listings in Okotoks, with no cost or obligation. Get your free Owner Console.