
Drake Landing Okotoks MLS® Listings
Okotoks Market Snapshot
Drake Landing is part of Okotoks. CREB reports statistics for Okotoks, so this snapshot shows Okotoks.
September 2026 · all residential property types
In September 2026, the benchmark price for Okotoks was $606,800, up 0.1% from September last year. 56 homes sold (up 10%), 74 new listings came on the market (up 7%), and there were 121 active listings at month end (up 5%). Among homes that sold, the median sale price was $622,500 (up 3.8%) and the average sale price was $642,130 (up 0.3%), and homes sold for 98.0% of their asking price. That is 2.2 months of supply, and homes spent 45 days on the market (up 9 days). Figures cover all residential property types.
View the numbers
| Measure | September 2026 | September last year |
|---|---|---|
| Benchmark price | $606,800 | $605,900 |
| Median price | $622,500 | $599,900 |
| Average price | $642,130 | $640,369 |
| Sold vs asking | 98.0% | 98.0% |
| Homes sold | 56 | 51 |
| New listings | 74 | 69 |
| Active listings | 121 | 115 |
| Months of supply | 2.2 | 2.3 |
| Days on market | 45 | 36 |
ShowHide 12-month trend
View the monthly numbers
| Month | Benchmark price | Sold | New listings | Active listings | Months of supply | Days on market | Median price | Average price | Sold vs asking |
|---|---|---|---|---|---|---|---|---|---|
| Oct 2025 | $620,500 | 45 | 91 | 137 | 3.0 | 46 | $669,900 | $643,549 | 98.0% |
| Nov 2025 | $598,700 | 51 | 56 | 110 | 2.2 | 39 | $588,000 | $578,440 | 98.0% |
| Dec 2025 | $600,000 | 26 | 20 | 74 | 2.9 | 45 | $647,238 | $689,679 | 98.0% |
| Jan 2026 | $599,500 | 33 | 52 | 79 | 2.4 | 52 | $610,000 | $623,418 | 98.0% |
| Feb 2026 | $612,300 | 36 | 63 | 96 | 2.7 | 41 | $595,750 | $676,603 | 98.0% |
| Mar 2026 | $618,100 | 52 | 94 | 117 | 2.3 | 37 | $651,000 | $652,042 | 98.0% |
| Apr 2026 | $627,600 | 58 | 113 | 149 | 2.6 | 26 | $712,500 | $723,481 | 98.0% |
| May 2026 | $618,900 | 71 | 121 | 177 | 2.5 | 30 | $681,500 | $699,665 | 98.0% |
| Jun 2026 | $618,600 | 70 | 89 | 164 | 2.3 | 35 | $638,500 | $676,620 | 98.0% |
| Jul 2026 | $617,900 | 70 | 78 | 141 | 2.0 | 41 | $582,000 | $609,964 | 98.0% |
| Aug 2026 | $608,400 | 55 | 68 | 133 | 2.4 | 50 | $635,000 | $628,004 | 98.0% |
| Sep 2026 | $606,800 | 56 | 74 | 121 | 2.2 | 45 | $622,500 | $642,130 | 98.0% |
September 2026 · detached homes
In September 2026, the benchmark price for Okotoks was $680,900, down 0.4% from September last year. 40 homes sold (up 5%), 54 new listings came on the market (up 6%), and there were 78 active listings at month end (up 3%). Among homes that sold, the median sale price was $706,000 (up 4.8%) and the average sale price was $723,783 (up 0.2%), and homes sold for 98.0% of their asking price. That is 2.0 months of supply, and homes spent 48 days on the market (up 11 days). Figures cover detached homes.
View the numbers
| Measure | September 2026 | September last year |
|---|---|---|
| Benchmark price | $680,900 | $683,500 |
| Median price | $706,000 | $673,450 |
| Average price | $723,783 | $722,577 |
| Sold vs asking | 98.0% | 99.0% |
| Homes sold | 40 | 38 |
| New listings | 54 | 51 |
| Active listings | 78 | 76 |
| Months of supply | 2.0 | 2.0 |
| Days on market | 48 | 37 |
ShowHide 12-month trend
View the monthly numbers
| Month | Benchmark price | Sold | New listings | Active listings | Months of supply | Days on market | Median price | Average price | Sold vs asking |
|---|---|---|---|---|---|---|---|---|---|
| Oct 2025 | $702,400 | 29 | 56 | 88 | 3.0 | 34 | $715,000 | $757,410 | 98.0% |
| Nov 2025 | $676,300 | 32 | 36 | 72 | 2.3 | 42 | $616,000 | $683,791 | 98.0% |
| Dec 2025 | $679,200 | 18 | 14 | 44 | 2.4 | 47 | $704,750 | $765,072 | 98.0% |
| Jan 2026 | $679,000 | 23 | 36 | 48 | 2.1 | 46 | $670,000 | $717,630 | 98.0% |
| Feb 2026 | $699,900 | 22 | 45 | 65 | 3.0 | 41 | $738,500 | $837,859 | 98.0% |
| Mar 2026 | $701,600 | 34 | 73 | 89 | 2.6 | 36 | $702,500 | $720,115 | 98.0% |
| Apr 2026 | $709,300 | 46 | 76 | 100 | 2.2 | 26 | $752,500 | $801,041 | 98.0% |
| May 2026 | $698,200 | 52 | 81 | 113 | 2.2 | 26 | $740,000 | $784,687 | 98.0% |
| Jun 2026 | $695,300 | 52 | 63 | 106 | 2.0 | 39 | $695,750 | $745,488 | 98.0% |
| Jul 2026 | $695,700 | 48 | 60 | 95 | 2.0 | 40 | $633,660 | $708,749 | 98.0% |
| Aug 2026 | $685,800 | 37 | 39 | 84 | 2.3 | 48 | $709,500 | $712,670 | 98.0% |
| Sep 2026 | $680,900 | 40 | 54 | 78 | 2.0 | 48 | $706,000 | $723,783 | 98.0% |
September 2026 · semi-detached homes
In September 2026, the benchmark price for Okotoks was $566,100, down 2.7% from September last year. 7 homes sold (up 250%), 6 new listings came on the market (up 20%), and there were 8 active listings at month end (down 20%). Among homes that sold, the median sale price was $520,000 (down 2.0%) and the average sale price was $533,768 (up 0.6%), and homes sold for 99.0% of their asking price. That is 1.1 months of supply, and homes spent 34 days on the market (up 6 days). Figures cover semi-detached homes.
View the numbers
| Measure | September 2026 | September last year |
|---|---|---|
| Benchmark price | $566,100 | $581,600 |
| Median price | $520,000 | $530,500 |
| Average price | $533,768 | $530,500 |
| Sold vs asking | 99.0% | 99.0% |
| Homes sold | 7 | 2 |
| New listings | 6 | 5 |
| Active listings | 8 | 10 |
| Months of supply | 1.1 | 5.0 |
| Days on market | 34 | 28 |
ShowHide 12-month trend
View the monthly numbers
| Month | Benchmark price | Sold | New listings | Active listings | Months of supply | Days on market | Median price | Average price | Sold vs asking |
|---|---|---|---|---|---|---|---|---|---|
| Oct 2025 | $584,100 | 6 | 9 | 12 | 2.0 | 89 | $613,750 | $618,050 | 99.0% |
| Nov 2025 | $565,600 | 4 | 8 | 10 | 2.5 | 32 | $608,500 | $620,500 | 97.0% |
| Dec 2025 | $557,700 | 4 | 2 | 8 | 2.0 | 27 | $554,500 | $547,094 | 98.0% |
| Jan 2026 | $551,000 | 3 | 3 | 8 | 2.7 | 75 | $515,000 | $536,333 | 98.0% |
| Feb 2026 | $553,600 | 3 | 11 | 16 | 5.3 | 23 | $630,000 | $629,633 | 99.0% |
| Mar 2026 | $583,400 | 8 | 4 | 8 | 1.0 | 43 | $699,900 | $674,162 | 100.0% |
| Apr 2026 | $596,700 | 2 | 13 | 17 | 8.5 | 23 | $725,500 | $725,500 | 100.0% |
| May 2026 | $581,200 | 6 | 12 | 21 | 3.5 | 68 | $540,000 | $545,650 | 99.0% |
| Jun 2026 | $588,900 | 7 | 5 | 13 | 1.9 | 21 | $575,000 | $591,571 | 98.0% |
| Jul 2026 | $580,600 | 4 | 6 | 12 | 3.0 | 23 | $505,500 | $515,250 | 98.0% |
| Aug 2026 | $565,900 | 8 | 11 | 12 | 1.5 | 52 | $534,500 | $556,612 | 98.0% |
| Sep 2026 | $566,100 | 7 | 6 | 8 | 1.1 | 34 | $520,000 | $533,768 | 99.0% |
September 2026 · row and townhouse homes
In September 2026, the benchmark price for Okotoks was $463,300, down 2.5% from September last year. 3 homes sold (down 50%), 8 new listings came on the market (up 167%), and there were 19 active listings at month end (up 36%). Among homes that sold, the median sale price was $322,200 (down 24.0%) and the average sale price was $340,733 (down 20.4%), and homes sold for 98.0% of their asking price. That is 6.3 months of supply, and homes spent 34 days on the market (down 3 days). Figures cover row and townhouse homes.
View the numbers
| Measure | September 2026 | September last year |
|---|---|---|
| Benchmark price | $463,300 | $475,400 |
| Median price | $322,200 | $424,000 |
| Average price | $340,733 | $428,317 |
| Sold vs asking | 98.0% | 99.0% |
| Homes sold | 3 | 6 |
| New listings | 8 | 3 |
| Active listings | 19 | 14 |
| Months of supply | 6.3 | 2.3 |
| Days on market | 34 | 37 |
ShowHide 12-month trend
View the monthly numbers
| Month | Benchmark price | Sold | New listings | Active listings | Months of supply | Days on market | Median price | Average price | Sold vs asking |
|---|---|---|---|---|---|---|---|---|---|
| Oct 2025 | $473,700 | 3 | 12 | 19 | 6.3 | 74 | $415,000 | $390,000 | 97.0% |
| Nov 2025 | $459,400 | 7 | 4 | 11 | 1.6 | 45 | $360,000 | $379,500 | 97.0% |
| Dec 2025 | $456,500 | 4 | 1 | 7 | 1.8 | 58 | $502,500 | $493,000 | 98.0% |
| Jan 2026 | $449,500 | 1 | 5 | 10 | 10.0 | 103 | $396,000 | $396,000 | 97.0% |
| Feb 2026 | $443,700 | 4 | 3 | 7 | 1.8 | 18 | $393,000 | $391,000 | 99.0% |
| Mar 2026 | $471,900 | 5 | 7 | 7 | 1.4 | 56 | $449,500 | $467,800 | 98.0% |
| Apr 2026 | $496,000 | 3 | 12 | 15 | 5.0 | 13 | $571,100 | $481,033 | 98.0% |
| May 2026 | $476,600 | 9 | 18 | 22 | 2.4 | 23 | $435,000 | $478,839 | 99.0% |
| Jun 2026 | $483,600 | 8 | 13 | 24 | 3.0 | 20 | $420,000 | $464,250 | 99.0% |
| Jul 2026 | $473,300 | 7 | 6 | 19 | 2.7 | 33 | $420,000 | $450,071 | 97.0% |
| Aug 2026 | $465,200 | 4 | 5 | 17 | 4.3 | 59 | $500,000 | $491,250 | 98.0% |
| Sep 2026 | $463,300 | 3 | 8 | 19 | 6.3 | 34 | $322,200 | $340,733 | 98.0% |
September 2026 · apartment condos
In September 2026, the benchmark price for Okotoks was $290,300, up 5.6% from September last year. 6 homes sold (up 20%), 6 new listings came on the market (down 40%), and there were 16 active listings at month end (up 7%). Among homes that sold, the median sale price was $355,000 (up 7.6%) and the average sale price was $374,900 (up 19.4%), and homes sold for 98.0% of their asking price. That is 2.7 months of supply, and homes spent 40 days on the market (up 1 days). Figures cover apartment condos.
View the numbers
| Measure | September 2026 | September last year |
|---|---|---|
| Benchmark price | $290,300 | $274,900 |
| Median price | $355,000 | $330,000 |
| Average price | $374,900 | $314,000 |
| Sold vs asking | 98.0% | 96.0% |
| Homes sold | 6 | 5 |
| New listings | 6 | 10 |
| Active listings | 16 | 15 |
| Months of supply | 2.7 | 3.0 |
| Days on market | 40 | 39 |
ShowHide 12-month trend
View the monthly numbers
| Month | Benchmark price | Sold | New listings | Active listings | Months of supply | Days on market | Median price | Average price | Sold vs asking |
|---|---|---|---|---|---|---|---|---|---|
| Oct 2025 | $281,500 | 7 | 14 | 18 | 2.6 | 48 | $280,000 | $302,357 | 97.0% |
| Nov 2025 | $278,900 | 8 | 8 | 17 | 2.1 | 27 | $314,500 | $310,081 | 99.0% |
| Dec 2025 | $273,400 | 0 | 3 | 15 | n/a | n/a | n/a | n/a | n/a |
| Jan 2026 | $273,600 | 6 | 8 | 13 | 2.2 | 58 | $345,000 | $343,717 | 98.0% |
| Feb 2026 | $266,800 | 7 | 4 | 8 | 1.1 | 61 | $345,000 | $353,129 | 98.0% |
| Mar 2026 | $279,400 | 5 | 10 | 13 | 2.6 | 21 | $322,000 | $338,000 | 96.0% |
| Apr 2026 | $282,300 | 7 | 12 | 17 | 2.4 | 33 | $289,900 | $317,129 | 98.0% |
| May 2026 | $295,600 | 4 | 10 | 21 | 5.3 | 38 | $336,050 | $322,275 | 99.0% |
| Jun 2026 | $291,300 | 3 | 8 | 21 | 7.0 | 38 | $250,000 | $247,667 | 96.0% |
| Jul 2026 | $292,800 | 11 | 6 | 15 | 1.4 | 58 | $315,000 | $315,091 | 98.0% |
| Aug 2026 | $284,700 | 6 | 13 | 20 | 3.3 | 55 | $294,750 | $292,250 | 97.0% |
| Sep 2026 | $290,300 | 6 | 6 | 16 | 2.7 | 40 | $355,000 | $374,900 | 98.0% |
Source: Calgary Real Estate Board (CREB®) monthly statistics. Benchmark price is the typical price of a home in the area. Median and average prices are for homes that sold in the month. Figures can be revised.
Own a home in this neighbourhood?
See what it is worth today. Get your own Owner Console from Jeff and Shirley Mikolajow: a home value update by email every month, with nearby listings in your area. Free, no obligation.
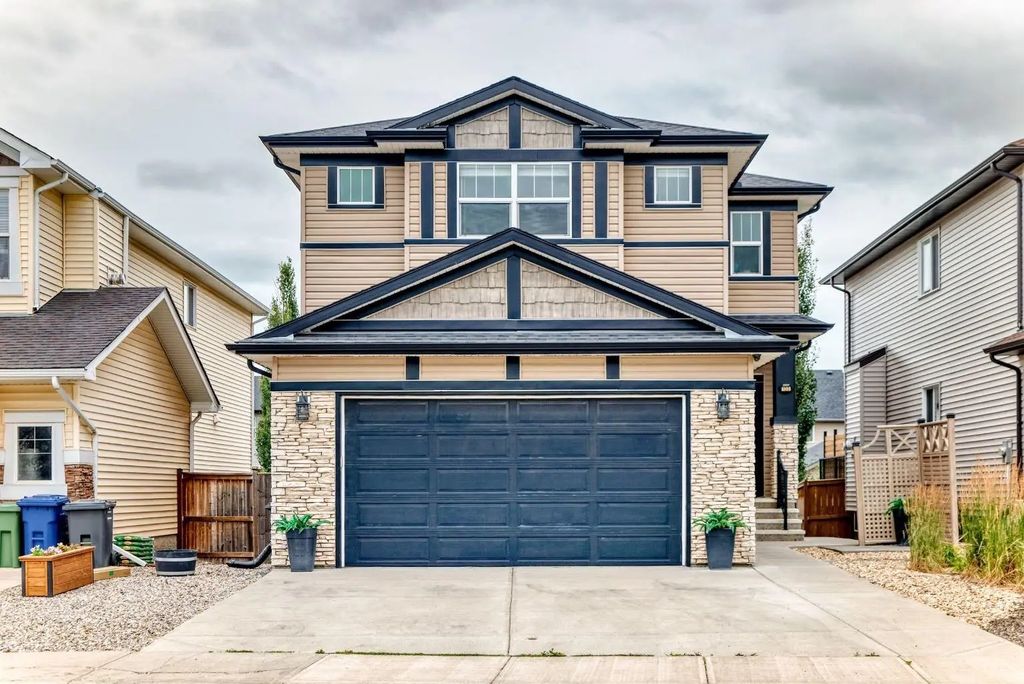
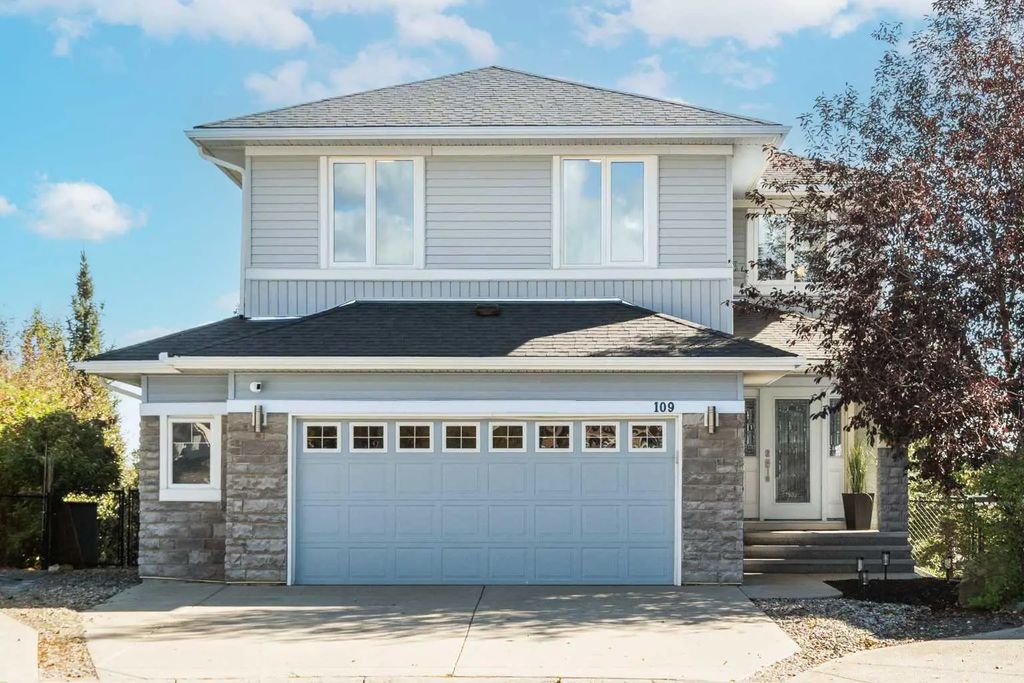
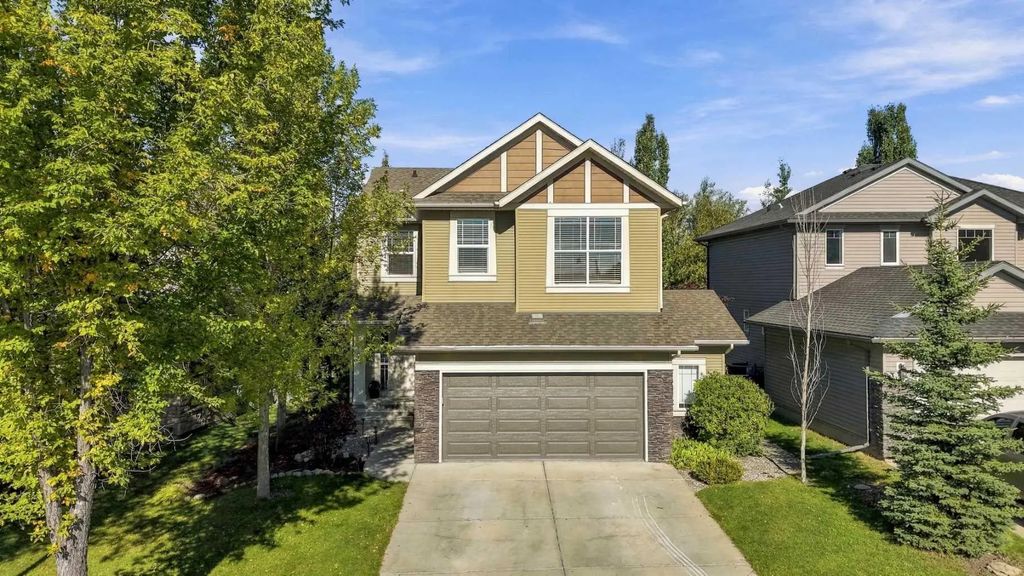
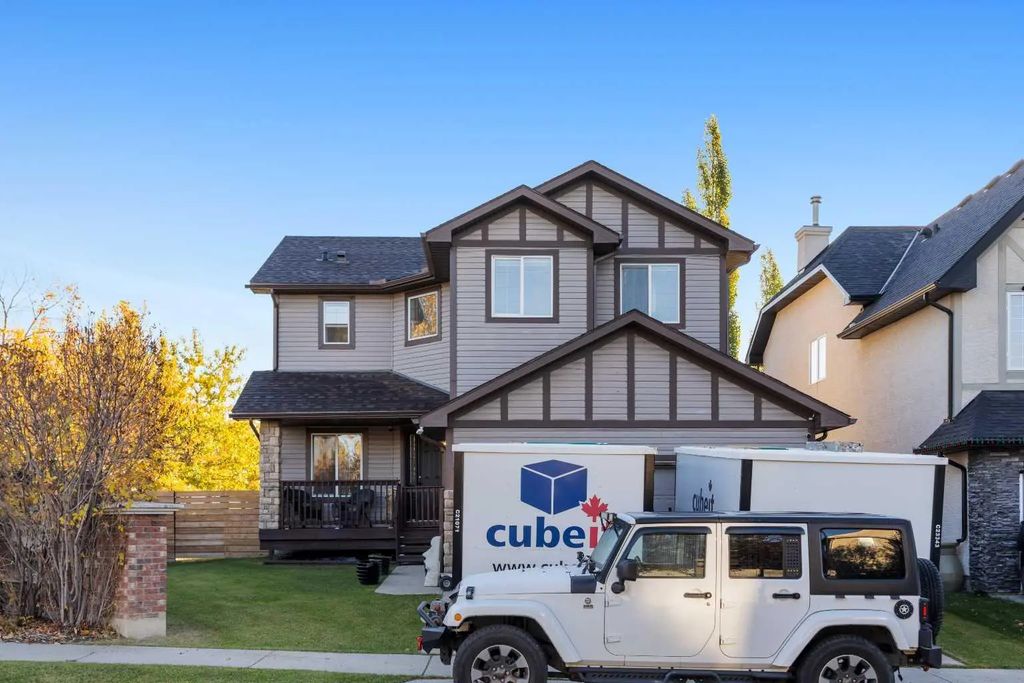
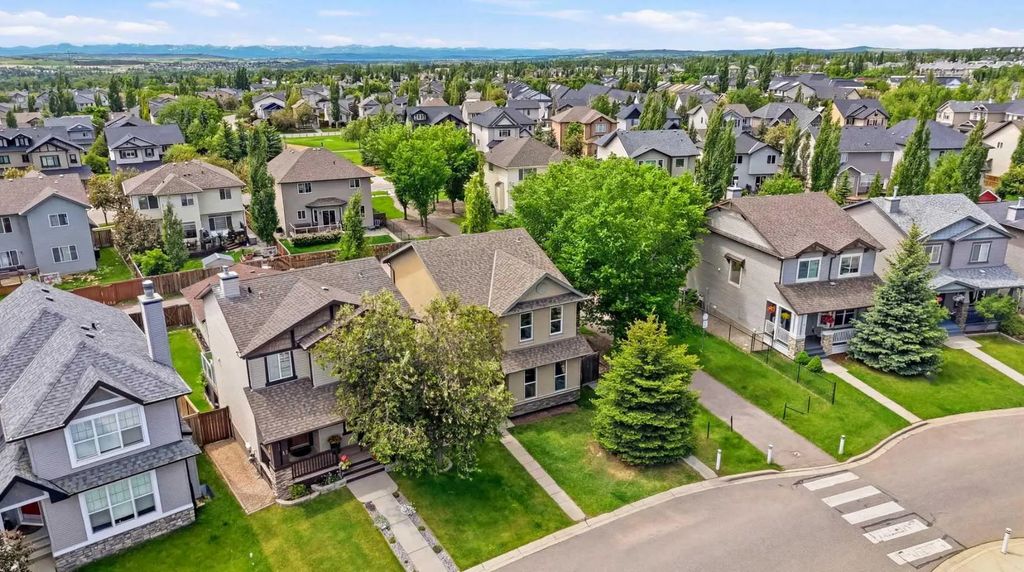
Track My Home's ValueDrake Landing is a southwest Okotoks community built out mainly between 2005 and 2011, best known worldwide for the Drake Landing Solar Community, a 52-home subdivision within it developed by the Town of Okotoks, ATCO, and Sterling Homes. From 2007, that project used 800 rooftop solar thermal collectors and 144 underground boreholes to store summer heat and deliver it back to homes in winter, at times meeting over 90 percent (and, in one season, effectively 100 percent) of space-heating needs, a first for a neighbourhood-scale system in North America. The achievement earned the 2011 Energy Globe Award and drew researchers and media attention from around the world. Beyond the solar landmark, Drake Landing offers pathways, parks, and views toward the Rocky Mountain foothills and Sheep River valley, with a strong community emphasis on water conservation and sustainable living that has carried through the neighbourhood's design.
Search Drake Landing Okotoks Real Estate Listings - Homes, Condos and Townhouses For Sale

Frequently Asked Questions About Drake Landing
Is Drake Landing still solar-heated today?
The original district-heating system made history from 2007 through the mid-2010s with record-setting solar performance, but the equipment deteriorated over time and the community began decommissioning it in 2024, with most homes converting to conventional natural gas furnaces. Buyers should confirm a specific home's current heating system before purchasing.
What made Drake Landing internationally famous?
It was one of the first neighbourhoods in North America to use seasonal underground thermal storage, storing summer solar heat in boreholes and releasing it in winter, which drew global attention from energy researchers, engineers, and media for over a decade.
What is Drake Landing like as a neighbourhood now?
It remains a well-established southwest Okotoks community with parks, pathways, and foothill and Sheep River valley views, and it retains a strong sustainability-minded character even as the solar heating system is phased out.
I’m a homeowner in Okotoks. What’s the best way to track my home’s value?
The easiest way is a free Owner Console from Jeff and Shirley Mikolajow. You get a home value update by email every month, plus nearby listings in Okotoks, with no cost or obligation. Get your free Owner Console.