
Crystal Green Okotoks MLS® Listings
Okotoks Market Snapshot
Crystal Green is part of Okotoks. CREB reports statistics for Okotoks, so this snapshot shows Okotoks.
September 2026 · all residential property types
In September 2026, the benchmark price for Okotoks was $606,800, up 0.1% from September last year. 56 homes sold (up 10%), 74 new listings came on the market (up 7%), and there were 121 active listings at month end (up 5%). Among homes that sold, the median sale price was $622,500 (up 3.8%) and the average sale price was $642,130 (up 0.3%), and homes sold for 98.0% of their asking price. That is 2.2 months of supply, and homes spent 45 days on the market (up 9 days). Figures cover all residential property types.
View the numbers
| Measure | September 2026 | September last year |
|---|---|---|
| Benchmark price | $606,800 | $605,900 |
| Median price | $622,500 | $599,900 |
| Average price | $642,130 | $640,369 |
| Sold vs asking | 98.0% | 98.0% |
| Homes sold | 56 | 51 |
| New listings | 74 | 69 |
| Active listings | 121 | 115 |
| Months of supply | 2.2 | 2.3 |
| Days on market | 45 | 36 |
ShowHide 12-month trend
View the monthly numbers
| Month | Benchmark price | Sold | New listings | Active listings | Months of supply | Days on market | Median price | Average price | Sold vs asking |
|---|---|---|---|---|---|---|---|---|---|
| Oct 2025 | $620,500 | 45 | 91 | 137 | 3.0 | 46 | $669,900 | $643,549 | 98.0% |
| Nov 2025 | $598,700 | 51 | 56 | 110 | 2.2 | 39 | $588,000 | $578,440 | 98.0% |
| Dec 2025 | $600,000 | 26 | 20 | 74 | 2.9 | 45 | $647,238 | $689,679 | 98.0% |
| Jan 2026 | $599,500 | 33 | 52 | 79 | 2.4 | 52 | $610,000 | $623,418 | 98.0% |
| Feb 2026 | $612,300 | 36 | 63 | 96 | 2.7 | 41 | $595,750 | $676,603 | 98.0% |
| Mar 2026 | $618,100 | 52 | 94 | 117 | 2.3 | 37 | $651,000 | $652,042 | 98.0% |
| Apr 2026 | $627,600 | 58 | 113 | 149 | 2.6 | 26 | $712,500 | $723,481 | 98.0% |
| May 2026 | $618,900 | 71 | 121 | 177 | 2.5 | 30 | $681,500 | $699,665 | 98.0% |
| Jun 2026 | $618,600 | 70 | 89 | 164 | 2.3 | 35 | $638,500 | $676,620 | 98.0% |
| Jul 2026 | $617,900 | 70 | 78 | 141 | 2.0 | 41 | $582,000 | $609,964 | 98.0% |
| Aug 2026 | $608,400 | 55 | 68 | 133 | 2.4 | 50 | $635,000 | $628,004 | 98.0% |
| Sep 2026 | $606,800 | 56 | 74 | 121 | 2.2 | 45 | $622,500 | $642,130 | 98.0% |
September 2026 · detached homes
In September 2026, the benchmark price for Okotoks was $680,900, down 0.4% from September last year. 40 homes sold (up 5%), 54 new listings came on the market (up 6%), and there were 78 active listings at month end (up 3%). Among homes that sold, the median sale price was $706,000 (up 4.8%) and the average sale price was $723,783 (up 0.2%), and homes sold for 98.0% of their asking price. That is 2.0 months of supply, and homes spent 48 days on the market (up 11 days). Figures cover detached homes.
View the numbers
| Measure | September 2026 | September last year |
|---|---|---|
| Benchmark price | $680,900 | $683,500 |
| Median price | $706,000 | $673,450 |
| Average price | $723,783 | $722,577 |
| Sold vs asking | 98.0% | 99.0% |
| Homes sold | 40 | 38 |
| New listings | 54 | 51 |
| Active listings | 78 | 76 |
| Months of supply | 2.0 | 2.0 |
| Days on market | 48 | 37 |
ShowHide 12-month trend
View the monthly numbers
| Month | Benchmark price | Sold | New listings | Active listings | Months of supply | Days on market | Median price | Average price | Sold vs asking |
|---|---|---|---|---|---|---|---|---|---|
| Oct 2025 | $702,400 | 29 | 56 | 88 | 3.0 | 34 | $715,000 | $757,410 | 98.0% |
| Nov 2025 | $676,300 | 32 | 36 | 72 | 2.3 | 42 | $616,000 | $683,791 | 98.0% |
| Dec 2025 | $679,200 | 18 | 14 | 44 | 2.4 | 47 | $704,750 | $765,072 | 98.0% |
| Jan 2026 | $679,000 | 23 | 36 | 48 | 2.1 | 46 | $670,000 | $717,630 | 98.0% |
| Feb 2026 | $699,900 | 22 | 45 | 65 | 3.0 | 41 | $738,500 | $837,859 | 98.0% |
| Mar 2026 | $701,600 | 34 | 73 | 89 | 2.6 | 36 | $702,500 | $720,115 | 98.0% |
| Apr 2026 | $709,300 | 46 | 76 | 100 | 2.2 | 26 | $752,500 | $801,041 | 98.0% |
| May 2026 | $698,200 | 52 | 81 | 113 | 2.2 | 26 | $740,000 | $784,687 | 98.0% |
| Jun 2026 | $695,300 | 52 | 63 | 106 | 2.0 | 39 | $695,750 | $745,488 | 98.0% |
| Jul 2026 | $695,700 | 48 | 60 | 95 | 2.0 | 40 | $633,660 | $708,749 | 98.0% |
| Aug 2026 | $685,800 | 37 | 39 | 84 | 2.3 | 48 | $709,500 | $712,670 | 98.0% |
| Sep 2026 | $680,900 | 40 | 54 | 78 | 2.0 | 48 | $706,000 | $723,783 | 98.0% |
September 2026 · semi-detached homes
In September 2026, the benchmark price for Okotoks was $566,100, down 2.7% from September last year. 7 homes sold (up 250%), 6 new listings came on the market (up 20%), and there were 8 active listings at month end (down 20%). Among homes that sold, the median sale price was $520,000 (down 2.0%) and the average sale price was $533,768 (up 0.6%), and homes sold for 99.0% of their asking price. That is 1.1 months of supply, and homes spent 34 days on the market (up 6 days). Figures cover semi-detached homes.
View the numbers
| Measure | September 2026 | September last year |
|---|---|---|
| Benchmark price | $566,100 | $581,600 |
| Median price | $520,000 | $530,500 |
| Average price | $533,768 | $530,500 |
| Sold vs asking | 99.0% | 99.0% |
| Homes sold | 7 | 2 |
| New listings | 6 | 5 |
| Active listings | 8 | 10 |
| Months of supply | 1.1 | 5.0 |
| Days on market | 34 | 28 |
ShowHide 12-month trend
View the monthly numbers
| Month | Benchmark price | Sold | New listings | Active listings | Months of supply | Days on market | Median price | Average price | Sold vs asking |
|---|---|---|---|---|---|---|---|---|---|
| Oct 2025 | $584,100 | 6 | 9 | 12 | 2.0 | 89 | $613,750 | $618,050 | 99.0% |
| Nov 2025 | $565,600 | 4 | 8 | 10 | 2.5 | 32 | $608,500 | $620,500 | 97.0% |
| Dec 2025 | $557,700 | 4 | 2 | 8 | 2.0 | 27 | $554,500 | $547,094 | 98.0% |
| Jan 2026 | $551,000 | 3 | 3 | 8 | 2.7 | 75 | $515,000 | $536,333 | 98.0% |
| Feb 2026 | $553,600 | 3 | 11 | 16 | 5.3 | 23 | $630,000 | $629,633 | 99.0% |
| Mar 2026 | $583,400 | 8 | 4 | 8 | 1.0 | 43 | $699,900 | $674,162 | 100.0% |
| Apr 2026 | $596,700 | 2 | 13 | 17 | 8.5 | 23 | $725,500 | $725,500 | 100.0% |
| May 2026 | $581,200 | 6 | 12 | 21 | 3.5 | 68 | $540,000 | $545,650 | 99.0% |
| Jun 2026 | $588,900 | 7 | 5 | 13 | 1.9 | 21 | $575,000 | $591,571 | 98.0% |
| Jul 2026 | $580,600 | 4 | 6 | 12 | 3.0 | 23 | $505,500 | $515,250 | 98.0% |
| Aug 2026 | $565,900 | 8 | 11 | 12 | 1.5 | 52 | $534,500 | $556,612 | 98.0% |
| Sep 2026 | $566,100 | 7 | 6 | 8 | 1.1 | 34 | $520,000 | $533,768 | 99.0% |
September 2026 · row and townhouse homes
In September 2026, the benchmark price for Okotoks was $463,300, down 2.5% from September last year. 3 homes sold (down 50%), 8 new listings came on the market (up 167%), and there were 19 active listings at month end (up 36%). Among homes that sold, the median sale price was $322,200 (down 24.0%) and the average sale price was $340,733 (down 20.4%), and homes sold for 98.0% of their asking price. That is 6.3 months of supply, and homes spent 34 days on the market (down 3 days). Figures cover row and townhouse homes.
View the numbers
| Measure | September 2026 | September last year |
|---|---|---|
| Benchmark price | $463,300 | $475,400 |
| Median price | $322,200 | $424,000 |
| Average price | $340,733 | $428,317 |
| Sold vs asking | 98.0% | 99.0% |
| Homes sold | 3 | 6 |
| New listings | 8 | 3 |
| Active listings | 19 | 14 |
| Months of supply | 6.3 | 2.3 |
| Days on market | 34 | 37 |
ShowHide 12-month trend
View the monthly numbers
| Month | Benchmark price | Sold | New listings | Active listings | Months of supply | Days on market | Median price | Average price | Sold vs asking |
|---|---|---|---|---|---|---|---|---|---|
| Oct 2025 | $473,700 | 3 | 12 | 19 | 6.3 | 74 | $415,000 | $390,000 | 97.0% |
| Nov 2025 | $459,400 | 7 | 4 | 11 | 1.6 | 45 | $360,000 | $379,500 | 97.0% |
| Dec 2025 | $456,500 | 4 | 1 | 7 | 1.8 | 58 | $502,500 | $493,000 | 98.0% |
| Jan 2026 | $449,500 | 1 | 5 | 10 | 10.0 | 103 | $396,000 | $396,000 | 97.0% |
| Feb 2026 | $443,700 | 4 | 3 | 7 | 1.8 | 18 | $393,000 | $391,000 | 99.0% |
| Mar 2026 | $471,900 | 5 | 7 | 7 | 1.4 | 56 | $449,500 | $467,800 | 98.0% |
| Apr 2026 | $496,000 | 3 | 12 | 15 | 5.0 | 13 | $571,100 | $481,033 | 98.0% |
| May 2026 | $476,600 | 9 | 18 | 22 | 2.4 | 23 | $435,000 | $478,839 | 99.0% |
| Jun 2026 | $483,600 | 8 | 13 | 24 | 3.0 | 20 | $420,000 | $464,250 | 99.0% |
| Jul 2026 | $473,300 | 7 | 6 | 19 | 2.7 | 33 | $420,000 | $450,071 | 97.0% |
| Aug 2026 | $465,200 | 4 | 5 | 17 | 4.3 | 59 | $500,000 | $491,250 | 98.0% |
| Sep 2026 | $463,300 | 3 | 8 | 19 | 6.3 | 34 | $322,200 | $340,733 | 98.0% |
September 2026 · apartment condos
In September 2026, the benchmark price for Okotoks was $290,300, up 5.6% from September last year. 6 homes sold (up 20%), 6 new listings came on the market (down 40%), and there were 16 active listings at month end (up 7%). Among homes that sold, the median sale price was $355,000 (up 7.6%) and the average sale price was $374,900 (up 19.4%), and homes sold for 98.0% of their asking price. That is 2.7 months of supply, and homes spent 40 days on the market (up 1 days). Figures cover apartment condos.
View the numbers
| Measure | September 2026 | September last year |
|---|---|---|
| Benchmark price | $290,300 | $274,900 |
| Median price | $355,000 | $330,000 |
| Average price | $374,900 | $314,000 |
| Sold vs asking | 98.0% | 96.0% |
| Homes sold | 6 | 5 |
| New listings | 6 | 10 |
| Active listings | 16 | 15 |
| Months of supply | 2.7 | 3.0 |
| Days on market | 40 | 39 |
ShowHide 12-month trend
View the monthly numbers
| Month | Benchmark price | Sold | New listings | Active listings | Months of supply | Days on market | Median price | Average price | Sold vs asking |
|---|---|---|---|---|---|---|---|---|---|
| Oct 2025 | $281,500 | 7 | 14 | 18 | 2.6 | 48 | $280,000 | $302,357 | 97.0% |
| Nov 2025 | $278,900 | 8 | 8 | 17 | 2.1 | 27 | $314,500 | $310,081 | 99.0% |
| Dec 2025 | $273,400 | 0 | 3 | 15 | n/a | n/a | n/a | n/a | n/a |
| Jan 2026 | $273,600 | 6 | 8 | 13 | 2.2 | 58 | $345,000 | $343,717 | 98.0% |
| Feb 2026 | $266,800 | 7 | 4 | 8 | 1.1 | 61 | $345,000 | $353,129 | 98.0% |
| Mar 2026 | $279,400 | 5 | 10 | 13 | 2.6 | 21 | $322,000 | $338,000 | 96.0% |
| Apr 2026 | $282,300 | 7 | 12 | 17 | 2.4 | 33 | $289,900 | $317,129 | 98.0% |
| May 2026 | $295,600 | 4 | 10 | 21 | 5.3 | 38 | $336,050 | $322,275 | 99.0% |
| Jun 2026 | $291,300 | 3 | 8 | 21 | 7.0 | 38 | $250,000 | $247,667 | 96.0% |
| Jul 2026 | $292,800 | 11 | 6 | 15 | 1.4 | 58 | $315,000 | $315,091 | 98.0% |
| Aug 2026 | $284,700 | 6 | 13 | 20 | 3.3 | 55 | $294,750 | $292,250 | 97.0% |
| Sep 2026 | $290,300 | 6 | 6 | 16 | 2.7 | 40 | $355,000 | $374,900 | 98.0% |
Source: Calgary Real Estate Board (CREB®) monthly statistics. Benchmark price is the typical price of a home in the area. Median and average prices are for homes that sold in the month. Figures can be revised.
Own a home in this neighbourhood?
See what it is worth today. Get your own Owner Console from Jeff and Shirley Mikolajow: a home value update by email every month, with nearby listings in your area. Free, no obligation.
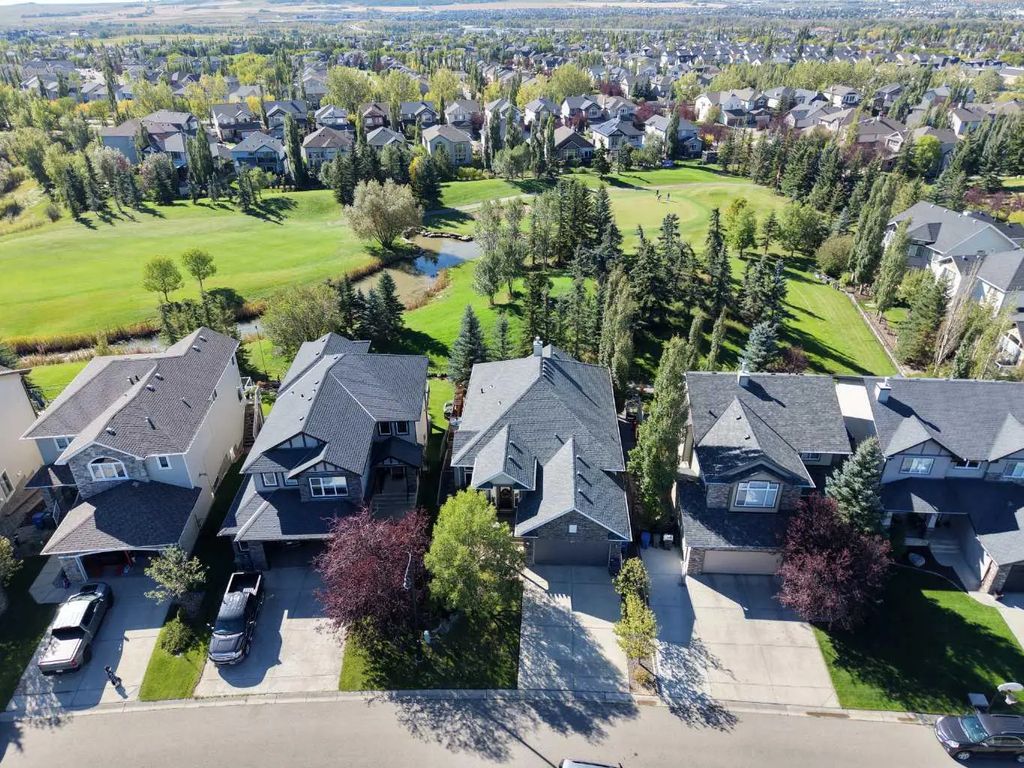
Track My Home's ValueCrystal Green is a golf-and-lake community on the north side of Okotoks, built around the Crystal Ridge Golf Club, a nine-hole course set high above the Sheep River valley with panoramic Rocky Mountain views and its own mini-golf course. Developed by Anthem Properties as part of the broader Crystal Ridge master plan, Crystal Green offered a mix of single-family and condo homes and is now a complete, built-out community, with many properties backing directly onto the golf course fairways. As part of the wider Crystal Shores Residents Association, Crystal Green owners also share in the private lake privileges enjoyed in neighbouring Crystal Shores, combining golf-course living with lake access in one address. Its location keeps residents close to Highway 2 for a quick commute to Calgary while still surrounded by mature landscaping and green space.
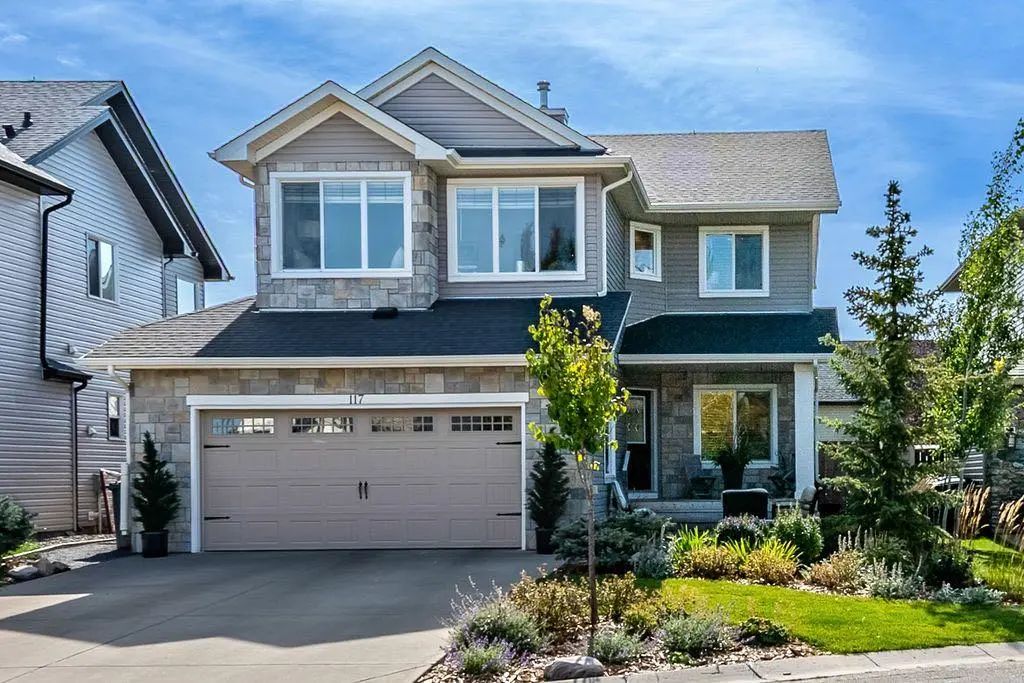
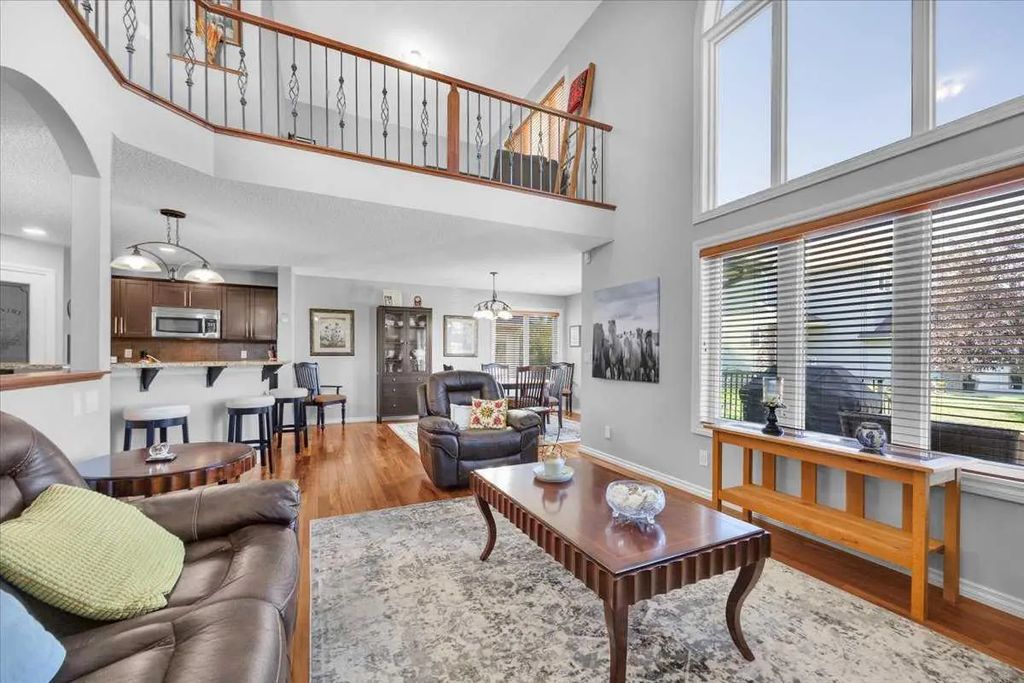
Search Crystal Green Okotoks Real Estate Listings - Homes, Condos and Townhouses For Sale

Frequently Asked Questions About Crystal Green
What golf course is Crystal Green built around?
Crystal Ridge Golf Club, a nine-hole course overlooking the Sheep River valley with mountain views and an on-site mini-golf course.
Does Crystal Green have its own lake?
No, the lake and private beach belong to neighbouring Crystal Shores, but Crystal Green residents are part of the Crystal Shores Residents Association and share in those lake privileges.
Is Crystal Green a newer or older community?
It was developed by Anthem Properties as a phase within the broader Crystal Ridge master plan and is now fully built out and sold out, making it a mature, established community rather than a new-build area.
I’m a homeowner in Okotoks. What’s the best way to track my home’s value?
The easiest way is a free Owner Console from Jeff and Shirley Mikolajow. You get a home value update by email every month, plus nearby listings in Okotoks, with no cost or obligation. Get your free Owner Console.