
Signal Hill West Calgary MLS® Listings
Houses, Condos and Real Estate For Sale by Calgary REALTORS®.
Signal Hill Market Snapshot
September 2026 · all residential property types
In September 2026, the benchmark price for Signal Hill was $635,900, down 3.0% from September last year. 17 homes sold (down 6%), 26 new listings came on the market (down 21%), and there were 49 active listings at month end (up 7%). Among homes that sold, the median sale price was $770,000 (up 22.0%) and the average sale price was $664,024 (down 5.6%), and homes sold for 98.0% of their asking price. That is 2.9 months of supply, and homes spent 33 days on the market (up 7 days). Figures cover all residential property types.
View the numbers
| Measure | September 2026 | September last year |
|---|---|---|
| Benchmark price | $635,900 | $655,300 |
| Median price | $770,000 | $631,000 |
| Average price | $664,024 | $703,508 |
| Sold vs asking | 98.0% | 98.0% |
| Homes sold | 17 | 18 |
| New listings | 26 | 33 |
| Active listings | 49 | 46 |
| Months of supply | 2.9 | 2.6 |
| Days on market | 33 | 26 |
ShowHide 12-month trend
View the monthly numbers
| Month | Benchmark price | Sold | New listings | Active listings | Months of supply | Days on market | Median price | Average price | Sold vs asking |
|---|---|---|---|---|---|---|---|---|---|
| Oct 2025 | $653,400 | 18 | 30 | 49 | 2.7 | 48 | $799,950 | $730,994 | 97.0% |
| Nov 2025 | $659,800 | 15 | 16 | 37 | 2.5 | 29 | $590,000 | $648,817 | 97.0% |
| Dec 2025 | $654,600 | 9 | 9 | 29 | 3.2 | 36 | $362,000 | $518,900 | 97.0% |
| Jan 2026 | $656,800 | 14 | 23 | 30 | 2.1 | 40 | $629,500 | $739,836 | 99.0% |
| Feb 2026 | $650,700 | 13 | 16 | 25 | 1.9 | 55 | $749,500 | $676,346 | 98.0% |
| Mar 2026 | $652,400 | 12 | 25 | 29 | 2.4 | 25 | $804,000 | $777,133 | 98.0% |
| Apr 2026 | $666,600 | 18 | 36 | 42 | 2.3 | 16 | $644,750 | $637,022 | 99.0% |
| May 2026 | $666,700 | 17 | 38 | 53 | 3.1 | 17 | $733,704 | $712,386 | 100.0% |
| Jun 2026 | $659,600 | 23 | 36 | 60 | 2.6 | 27 | $770,000 | $715,451 | 100.0% |
| Jul 2026 | $651,600 | 24 | 31 | 53 | 2.2 | 37 | $482,750 | $616,606 | 98.0% |
| Aug 2026 | $635,800 | 22 | 34 | 54 | 2.5 | 25 | $571,550 | $659,659 | 98.0% |
| Sep 2026 | $635,900 | 17 | 26 | 49 | 2.9 | 33 | $770,000 | $664,024 | 98.0% |
September 2026 · detached homes
In September 2026, the benchmark price for Signal Hill was $944,800, up 1.1% from September last year. 9 homes sold (up 13%), 14 new listings came on the market (down 18%), and there were 22 active listings at month end (unchanged). Among homes that sold, the median sale price was $885,000 (down 14.7%) and the average sale price was $896,222 (down 13.0%), and homes sold for 99.0% of their asking price. That is 2.4 months of supply, and homes spent 36 days on the market (up 15 days). Figures cover detached homes.
View the numbers
| Measure | September 2026 | September last year |
|---|---|---|
| Benchmark price | $944,800 | $934,500 |
| Median price | $885,000 | $1,037,000 |
| Average price | $896,222 | $1,029,875 |
| Sold vs asking | 99.0% | 99.0% |
| Homes sold | 9 | 8 |
| New listings | 14 | 17 |
| Active listings | 22 | 22 |
| Months of supply | 2.4 | 2.8 |
| Days on market | 36 | 21 |
ShowHide 12-month trend
View the monthly numbers
| Month | Benchmark price | Sold | New listings | Active listings | Months of supply | Days on market | Median price | Average price | Sold vs asking |
|---|---|---|---|---|---|---|---|---|---|
| Oct 2025 | $925,600 | 9 | 13 | 22 | 2.4 | 43 | $1,015,000 | $1,016,433 | 98.0% |
| Nov 2025 | $939,800 | 7 | 7 | 15 | 2.1 | 33 | $852,000 | $962,179 | 98.0% |
| Dec 2025 | $945,600 | 2 | 4 | 14 | 7.0 | 21 | $1,150,000 | $1,150,000 | 96.0% |
| Jan 2026 | $951,000 | 6 | 11 | 13 | 2.2 | 31 | $1,085,600 | $1,162,283 | 99.0% |
| Feb 2026 | $938,400 | 6 | 8 | 10 | 1.7 | 50 | $880,000 | $944,583 | 97.0% |
| Mar 2026 | $948,200 | 6 | 11 | 12 | 2.0 | 21 | $971,750 | $1,054,583 | 100.0% |
| Apr 2026 | $970,800 | 7 | 16 | 19 | 2.7 | 13 | $840,000 | $890,643 | 98.0% |
| May 2026 | $981,100 | 9 | 20 | 22 | 2.4 | 14 | $890,000 | $977,489 | 101.0% |
| Jun 2026 | $975,000 | 14 | 22 | 28 | 2.0 | 22 | $856,500 | $877,993 | 100.0% |
| Jul 2026 | $972,700 | 9 | 13 | 22 | 2.4 | 32 | $935,000 | $942,933 | 98.0% |
| Aug 2026 | $943,000 | 9 | 19 | 26 | 2.9 | 18 | $900,000 | $969,333 | 98.0% |
| Sep 2026 | $944,800 | 9 | 14 | 22 | 2.4 | 36 | $885,000 | $896,222 | 99.0% |
September 2026 · apartment condos
In September 2026, the benchmark price for Signal Hill was $327,300, down 7.6% from September last year. 6 homes sold (up 20%), 8 new listings came on the market (down 33%), and there were 19 active listings at month end (up 36%). Among homes that sold, the median sale price was $291,000 (down 20.3%) and the average sale price was $352,400 (down 5.8%), and homes sold for 98.0% of their asking price. That is 3.2 months of supply, and homes spent 28 days on the market (up 3 days). Figures cover apartment condos.
View the numbers
| Measure | September 2026 | September last year |
|---|---|---|
| Benchmark price | $327,300 | $354,200 |
| Median price | $291,000 | $364,900 |
| Average price | $352,400 | $374,080 |
| Sold vs asking | 98.0% | 99.0% |
| Homes sold | 6 | 5 |
| New listings | 8 | 12 |
| Active listings | 19 | 14 |
| Months of supply | 3.2 | 2.8 |
| Days on market | 28 | 25 |
ShowHide 12-month trend
View the monthly numbers
| Month | Benchmark price | Sold | New listings | Active listings | Months of supply | Days on market | Median price | Average price | Sold vs asking |
|---|---|---|---|---|---|---|---|---|---|
| Oct 2025 | $349,900 | 4 | 12 | 19 | 4.8 | 62 | $315,500 | $314,000 | 96.0% |
| Nov 2025 | $347,300 | 7 | 8 | 16 | 2.3 | 24 | $320,000 | $336,071 | 97.0% |
| Dec 2025 | $341,800 | 5 | 1 | 8 | 1.6 | 35 | $299,998 | $329,020 | 98.0% |
| Jan 2026 | $338,700 | 6 | 9 | 10 | 1.7 | 44 | $338,500 | $361,000 | 100.0% |
| Feb 2026 | $341,200 | 4 | 3 | 8 | 2.0 | 60 | $363,500 | $360,000 | 97.0% |
| Mar 2026 | $336,900 | 3 | 7 | 9 | 3.0 | 34 | $350,000 | $330,533 | 97.0% |
| Apr 2026 | $340,100 | 6 | 9 | 11 | 1.8 | 20 | $363,750 | $376,233 | 99.0% |
| May 2026 | $342,900 | 4 | 10 | 16 | 4.0 | 20 | $297,950 | $296,475 | 98.0% |
| Jun 2026 | $340,700 | 3 | 9 | 21 | 7.0 | 12 | $334,000 | $324,333 | 98.0% |
| Jul 2026 | $341,800 | 10 | 8 | 17 | 1.7 | 43 | $308,500 | $325,915 | 99.0% |
| Aug 2026 | $335,900 | 5 | 9 | 19 | 3.8 | 28 | $424,900 | $391,280 | 99.0% |
| Sep 2026 | $327,300 | 6 | 8 | 19 | 3.2 | 28 | $291,000 | $352,400 | 98.0% |
Source: Calgary Real Estate Board (CREB®) monthly statistics. Benchmark price is the typical price of a home in the area. Median and average prices are for homes that sold in the month. Figures can be revised.
Own a home in this neighbourhood?
See what it is worth today. Get your own Owner Console from Jeff and Shirley Mikolajow: a home value update by email every month, with nearby listings in your area. Free, no obligation.
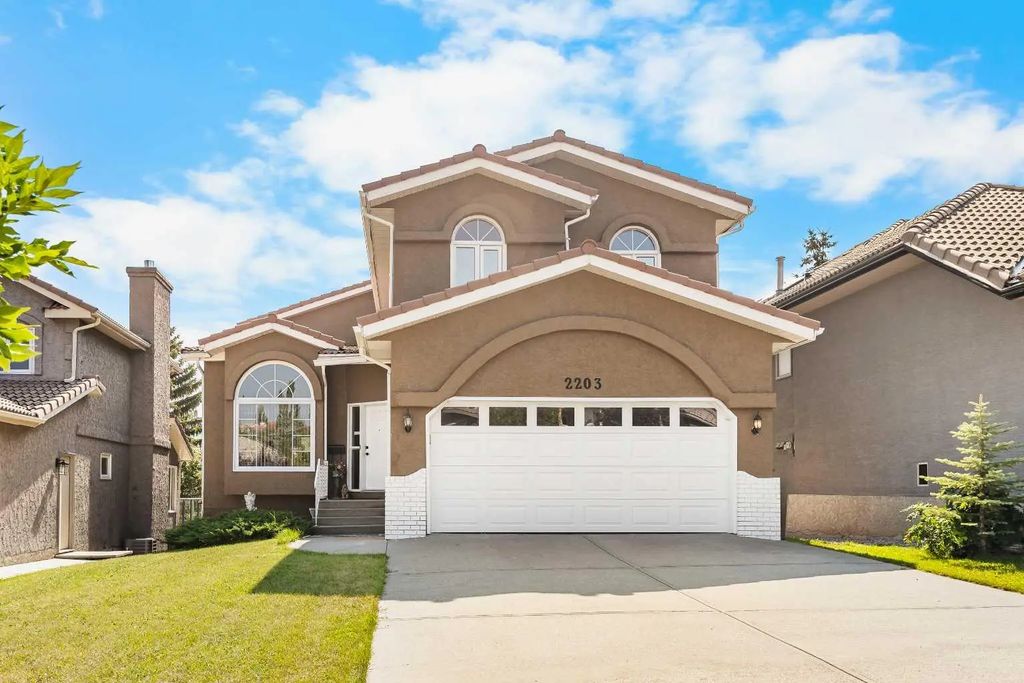
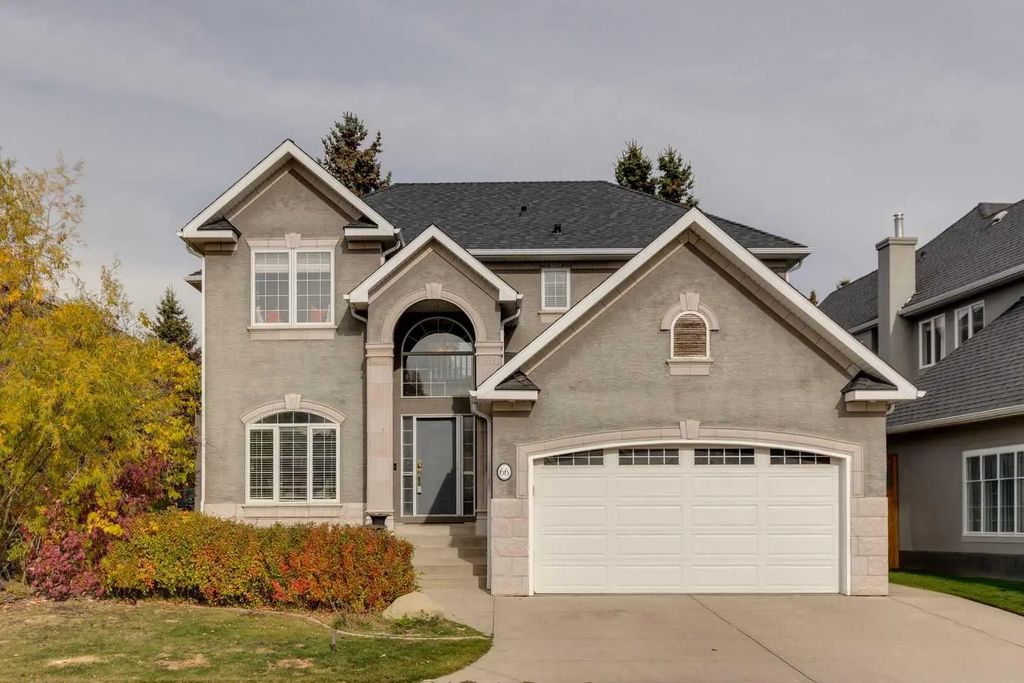
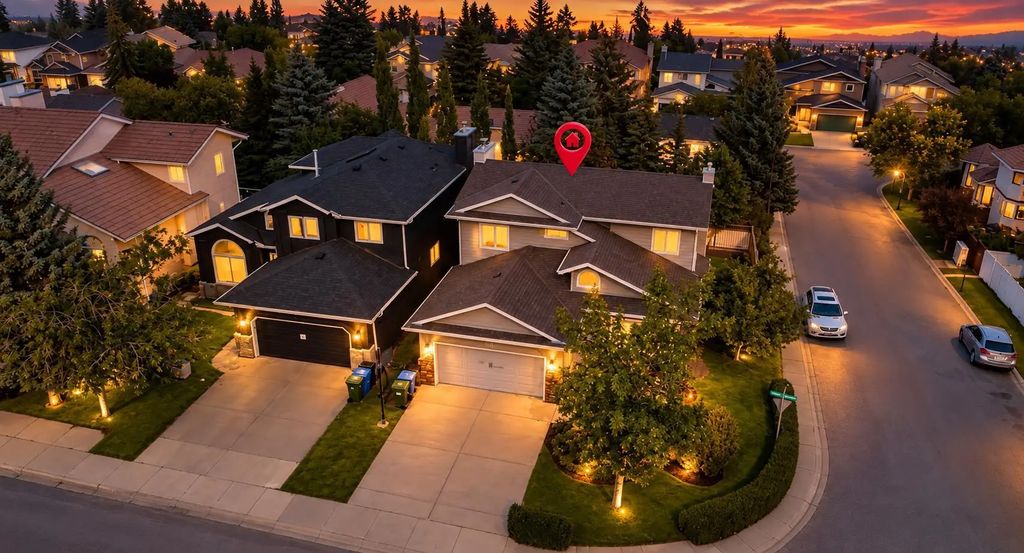
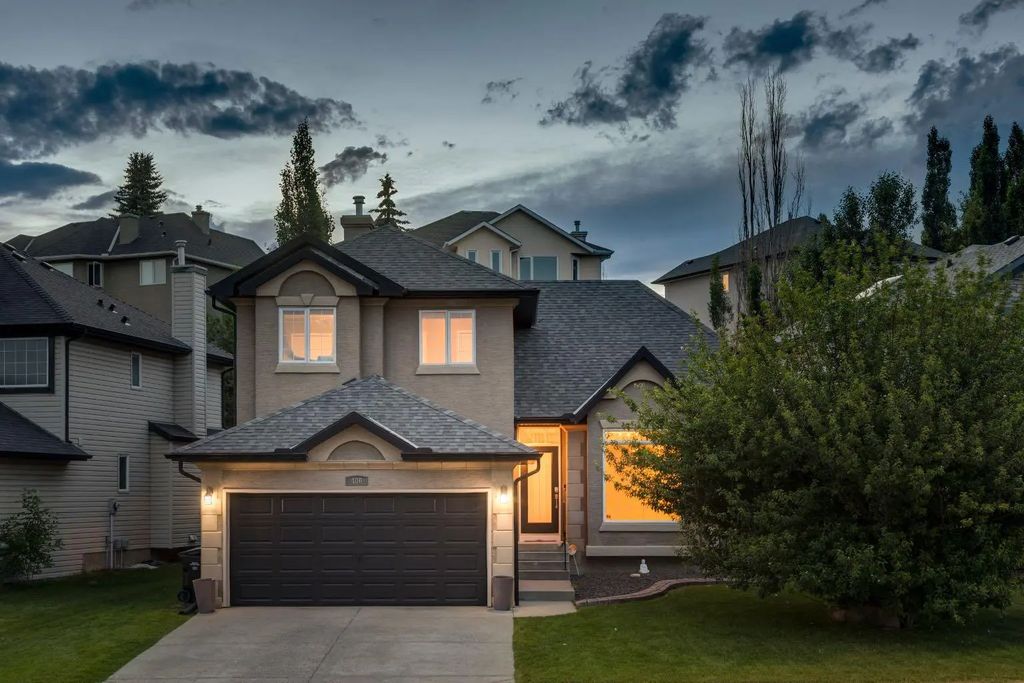
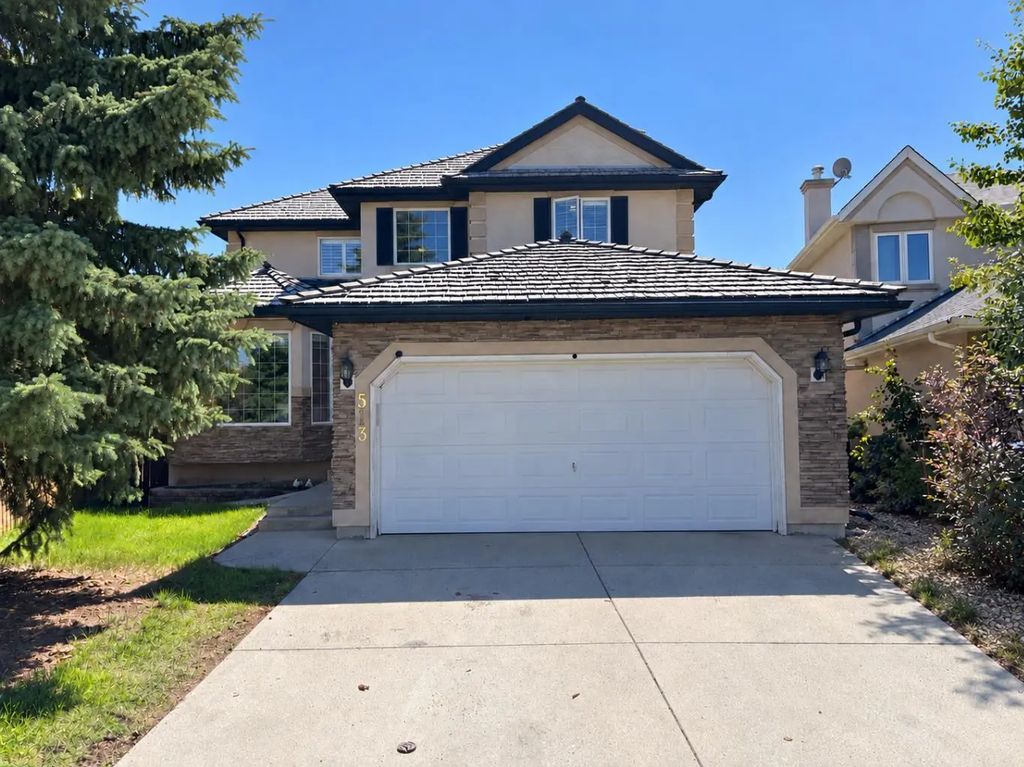
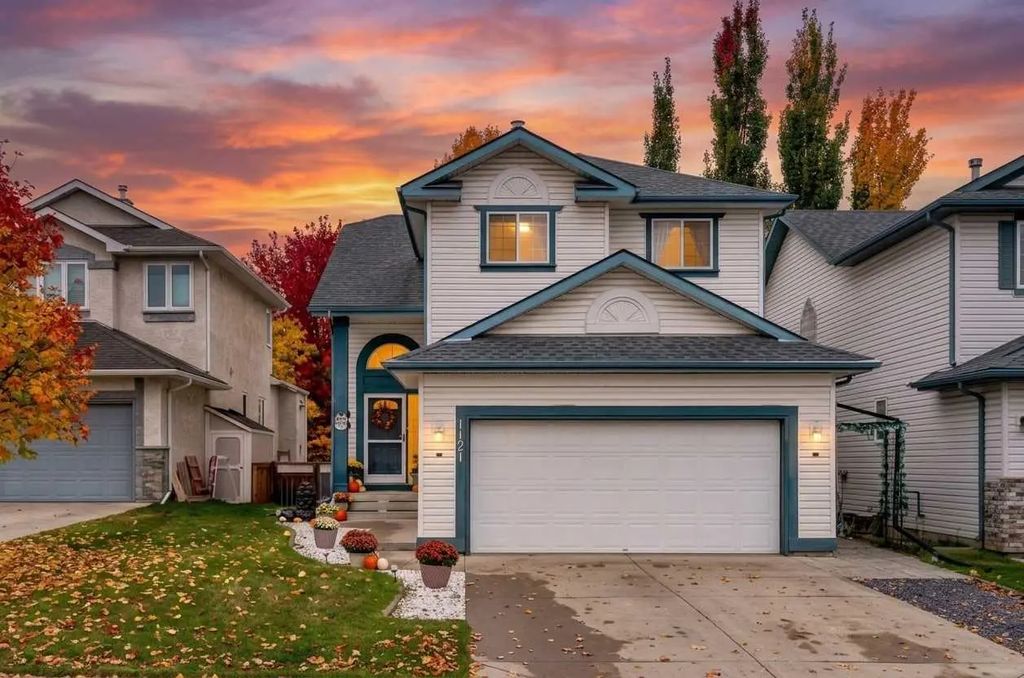
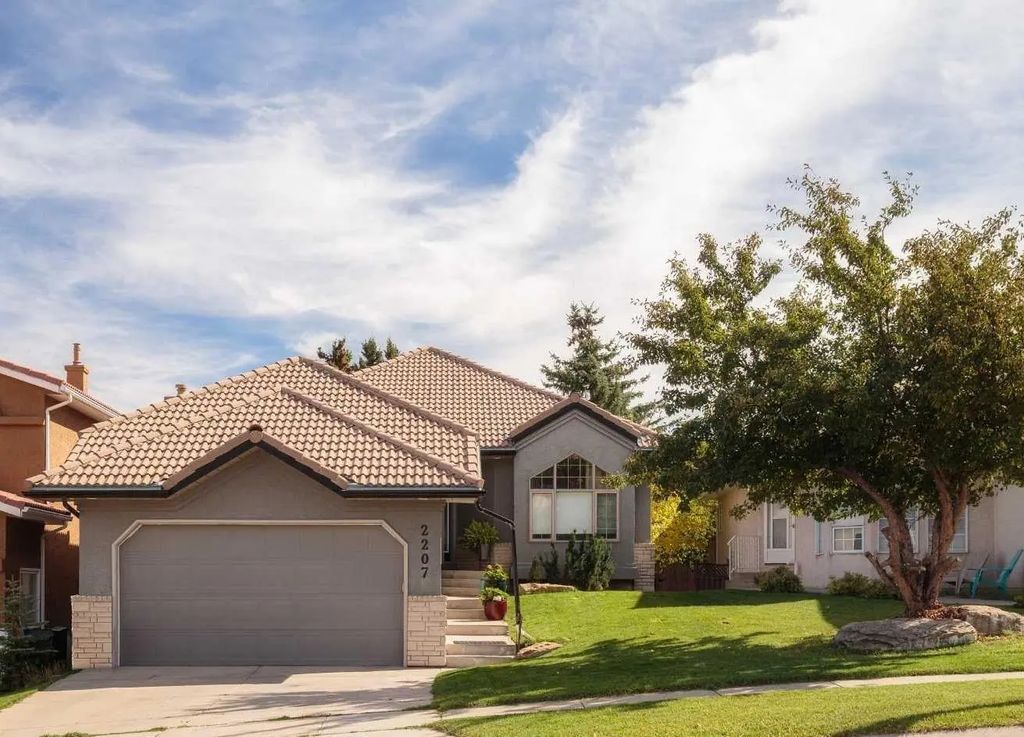
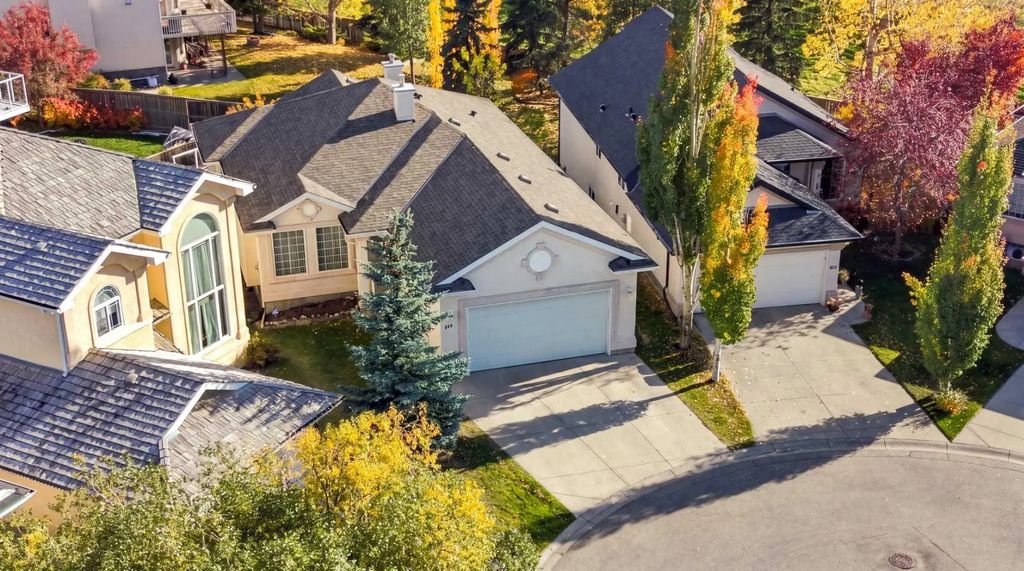
Track My Home's ValueSignal Hill is a southwest Calgary community built out through the late 1980s and 1990s as the city expanded west along the ridge above the Bow River valley. It takes its name from the Signal Hill Battery, a historic site where soldiers trained during both World Wars; Battalion Park, with its 16,000 whitewashed stones laid out by trainees, still marks the hillside today. Housing includes two-storey family homes on standard lots, walkout properties on the ridge with valley and mountain views, low-maintenance villas aimed at empty nesters, and a range of townhomes and condos. Sarcee Trail, Glenmore Trail, Highway 1 and Bow Trail provide access across the city, and the West LRT's 69 Street Station serves the community directly. Signal Hill Centre and neighbouring Westhills Towne Centre supply most day-to-day shopping and dining, while Richmond Square and Westside Recreation Centre cover medical and fitness needs.
- All Listings
- Under $100,000
- $200,000 - $300,000
- $300,000 - $400,000
- $400,000 - $500,000
- $500,000 - $600,000
- $600,000 - $700,000
- $700,000 - $800,000
- $800,000 - $900,000
- $900,000 - $1,000,000
- Over $1,000,000



Frequently Asked Questions About Signal Hill
Where does the name Signal Hill come from?
The community is named for the Signal Hill Battery, a historic site where Canadian soldiers trained during both World Wars. Battalion Park, within the community, preserves this history with roughly 16,000 whitewashed stones originally laid out by trainees on the hillside.
When was Signal Hill developed?
Signal Hill was built out mainly through the late 1980s and 1990s as part of Calgary’s westward expansion along the ridge above the Bow River valley, making it a more established community than newer developments further west.
What transit and shopping options are near Signal Hill?
The West LRT’s 69 Street Station serves the community directly, and Signal Hill Centre and the adjacent Westhills Towne Centre provide grocery stores, retail and restaurants within walking or short driving distance of most homes.
I’m a homeowner in Signal Hill. What’s the best way to track my home’s value?
The easiest way is a free Owner Console from Jeff and Shirley Mikolajow. You get a home value update by email every month, plus nearby listings in Signal Hill, with no cost or obligation. Get your free Owner Console.
Other Great Neighbourhoods in West Calgary
- Aspen Woods
- Christie Park Estate
- Coach Hill
- Cougar Ridge
- Crestmont
- Discovery Ridge
- Garrison Green
- Glamorgan
- Glenbrook
- Glendale Meadows
- Lakeview
- Lakeview Village
- Lincoln Park
- North Glenmore Park
- Prominence Patterson
- Rosscarrock
- Rutland Park
- Signal Hill
- Springbank Hill
- Spruce Cliff
- Strathcona Park
- The Slopes
- Wentworth
- West Hills
- West Springs
- Westgate
- Wildwood
- Medicine Hill
- Osprey Hill
- Valley Ridge