
Cougar Ridge West Calgary MLS® Listings
Houses, Condos and Real Estate For Sale by Calgary REALTORS®.
West Calgary Market Snapshot
Cougar Ridge had too few sales in September 2026 for community-level statistics, so this snapshot shows West Calgary, the district it belongs to.
September 2026 · all residential property types
In September 2026, the benchmark price for West Calgary was $721,200, up 1.7% from September last year. 156 homes sold (down 10%), 319 new listings came on the market (down 13%), and there were 556 active listings at month end (down 9%). Among homes that sold, the median sale price was $790,250 (up 7.5%) and the average sale price was $833,302 (up 7.5%), and homes sold for 98.0% of their asking price. That is 3.6 months of supply, and homes spent 36 days on the market (down 1 days). Figures cover all residential property types.
View the numbers
| Measure | September 2026 | September last year |
|---|---|---|
| Benchmark price | $721,200 | $708,800 |
| Median price | $790,250 | $735,000 |
| Average price | $833,302 | $775,210 |
| Sold vs asking | 98.0% | 98.0% |
| Homes sold | 156 | 173 |
| New listings | 319 | 365 |
| Active listings | 556 | 608 |
| Months of supply | 3.6 | 3.5 |
| Days on market | 36 | 37 |
ShowHide 12-month trend
View the monthly numbers
| Month | Benchmark price | Sold | New listings | Active listings | Months of supply | Days on market | Median price | Average price | Sold vs asking |
|---|---|---|---|---|---|---|---|---|---|
| Oct 2025 | $700,800 | 186 | 282 | 569 | 3.1 | 39 | $770,500 | $839,286 | 98.0% |
| Nov 2025 | $693,900 | 155 | 168 | 460 | 3.0 | 49 | $669,800 | $756,740 | 97.0% |
| Dec 2025 | $684,300 | 103 | 95 | 299 | 2.9 | 50 | $705,000 | $787,776 | 98.0% |
| Jan 2026 | $698,400 | 115 | 277 | 386 | 3.4 | 44 | $719,900 | $763,950 | 98.0% |
| Feb 2026 | $706,900 | 161 | 271 | 439 | 2.7 | 34 | $675,000 | $759,028 | 99.0% |
| Mar 2026 | $719,500 | 202 | 341 | 487 | 2.4 | 28 | $765,000 | $833,951 | 99.0% |
| Apr 2026 | $727,800 | 231 | 372 | 529 | 2.3 | 31 | $750,000 | $816,126 | 98.0% |
| May 2026 | $726,600 | 249 | 440 | 599 | 2.4 | 26 | $767,500 | $833,152 | 99.0% |
| Jun 2026 | $734,800 | 233 | 357 | 582 | 2.5 | 29 | $775,000 | $852,935 | 98.0% |
| Jul 2026 | $723,200 | 220 | 329 | 554 | 2.5 | 33 | $725,000 | $797,109 | 98.0% |
| Aug 2026 | $719,200 | 194 | 306 | 528 | 2.7 | 36 | $711,805 | $786,085 | 97.0% |
| Sep 2026 | $721,200 | 156 | 319 | 556 | 3.6 | 36 | $790,250 | $833,302 | 98.0% |
September 2026 · detached homes
In September 2026, the benchmark price for West Calgary was $993,700, up 2.7% from September last year. 85 homes sold (unchanged), 163 new listings came on the market (down 6%), and there were 233 active listings at month end (down 8%). Among homes that sold, the median sale price was $967,500 (up 1.8%) and the average sale price was $1,110,139 (up 7.0%), and homes sold for 98.0% of their asking price. That is 2.7 months of supply, and homes spent 29 days on the market (up 2 days). Figures cover detached homes.
View the numbers
| Measure | September 2026 | September last year |
|---|---|---|
| Benchmark price | $993,700 | $967,700 |
| Median price | $967,500 | $950,000 |
| Average price | $1,110,139 | $1,037,080 |
| Sold vs asking | 98.0% | 98.0% |
| Homes sold | 85 | 85 |
| New listings | 163 | 174 |
| Active listings | 233 | 253 |
| Months of supply | 2.7 | 3.0 |
| Days on market | 29 | 27 |
ShowHide 12-month trend
View the monthly numbers
| Month | Benchmark price | Sold | New listings | Active listings | Months of supply | Days on market | Median price | Average price | Sold vs asking |
|---|---|---|---|---|---|---|---|---|---|
| Oct 2025 | $958,200 | 108 | 136 | 222 | 2.1 | 33 | $923,750 | $1,090,420 | 98.0% |
| Nov 2025 | $943,000 | 75 | 74 | 178 | 2.4 | 52 | $843,500 | $1,006,611 | 97.0% |
| Dec 2025 | $935,100 | 55 | 44 | 109 | 2.0 | 53 | $895,000 | $1,080,480 | 98.0% |
| Jan 2026 | $958,800 | 59 | 103 | 131 | 2.2 | 40 | $935,000 | $1,018,241 | 99.0% |
| Feb 2026 | $973,500 | 76 | 112 | 147 | 1.9 | 30 | $955,000 | $1,062,324 | 100.0% |
| Mar 2026 | $997,400 | 107 | 164 | 171 | 1.6 | 24 | $984,900 | $1,112,400 | 99.0% |
| Apr 2026 | $1,007,600 | 116 | 179 | 201 | 1.7 | 25 | $980,000 | $1,121,983 | 99.0% |
| May 2026 | $1,005,200 | 133 | 215 | 239 | 1.8 | 21 | $955,000 | $1,110,344 | 100.0% |
| Jun 2026 | $1,025,000 | 121 | 172 | 232 | 1.9 | 22 | $1,002,000 | $1,185,602 | 99.0% |
| Jul 2026 | $1,003,800 | 107 | 151 | 211 | 2.0 | 25 | $1,020,000 | $1,117,837 | 98.0% |
| Aug 2026 | $992,500 | 93 | 151 | 218 | 2.3 | 31 | $955,000 | $1,065,305 | 98.0% |
| Sep 2026 | $993,700 | 85 | 163 | 233 | 2.7 | 29 | $967,500 | $1,110,139 | 98.0% |
September 2026 · semi-detached homes
In September 2026, the benchmark price for West Calgary was $826,000, up 1.5% from September last year. 11 homes sold (unchanged), 34 new listings came on the market (up 31%), and there were 57 active listings at month end (up 36%). Among homes that sold, the median sale price was $737,500 (down 16.5%) and the average sale price was $766,727 (down 8.6%), and homes sold for 98.0% of their asking price. That is 5.2 months of supply, and homes spent 37 days on the market (down 0 days). Figures cover semi-detached homes.
View the numbers
| Measure | September 2026 | September last year |
|---|---|---|
| Benchmark price | $826,000 | $814,100 |
| Median price | $737,500 | $883,500 |
| Average price | $766,727 | $839,045 |
| Sold vs asking | 98.0% | 99.0% |
| Homes sold | 11 | 11 |
| New listings | 34 | 26 |
| Active listings | 57 | 42 |
| Months of supply | 5.2 | 3.8 |
| Days on market | 37 | 37 |
ShowHide 12-month trend
View the monthly numbers
| Month | Benchmark price | Sold | New listings | Active listings | Months of supply | Days on market | Median price | Average price | Sold vs asking |
|---|---|---|---|---|---|---|---|---|---|
| Oct 2025 | $814,200 | 11 | 24 | 46 | 4.2 | 47 | $850,000 | $905,091 | 98.0% |
| Nov 2025 | $805,600 | 11 | 15 | 39 | 3.6 | 28 | $827,500 | $914,045 | 98.0% |
| Dec 2025 | $800,200 | 5 | 7 | 31 | 6.2 | 38 | $766,000 | $726,000 | 99.0% |
| Jan 2026 | $806,800 | 11 | 18 | 32 | 2.9 | 59 | $740,000 | $770,773 | 98.0% |
| Feb 2026 | $819,900 | 14 | 25 | 38 | 2.7 | 29 | $667,500 | $729,950 | 99.0% |
| Mar 2026 | $832,300 | 18 | 32 | 46 | 2.6 | 21 | $803,750 | $846,256 | 99.0% |
| Apr 2026 | $845,100 | 23 | 34 | 48 | 2.1 | 37 | $760,000 | $831,709 | 99.0% |
| May 2026 | $844,100 | 23 | 35 | 55 | 2.4 | 29 | $840,000 | $803,157 | 99.0% |
| Jun 2026 | $846,800 | 25 | 39 | 55 | 2.2 | 35 | $674,900 | $713,759 | 99.0% |
| Jul 2026 | $839,400 | 24 | 30 | 52 | 2.2 | 34 | $734,500 | $825,721 | 98.0% |
| Aug 2026 | $824,000 | 19 | 31 | 46 | 2.4 | 28 | $690,000 | $890,810 | 99.0% |
| Sep 2026 | $826,000 | 11 | 34 | 57 | 5.2 | 37 | $737,500 | $766,727 | 98.0% |
September 2026 · row and townhouse homes
In September 2026, the benchmark price for West Calgary was $439,600, down 6.0% from September last year. 22 homes sold (down 37%), 56 new listings came on the market (down 15%), and there were 118 active listings at month end (down 9%). Among homes that sold, the median sale price was $533,700 (down 4.7%) and the average sale price was $583,405 (up 4.6%), and homes sold for 99.0% of their asking price. That is 5.4 months of supply, and homes spent 48 days on the market (up 10 days). Figures cover row and townhouse homes.
View the numbers
| Measure | September 2026 | September last year |
|---|---|---|
| Benchmark price | $439,600 | $467,900 |
| Median price | $533,700 | $560,000 |
| Average price | $583,405 | $557,819 |
| Sold vs asking | 99.0% | 98.0% |
| Homes sold | 22 | 35 |
| New listings | 56 | 66 |
| Active listings | 118 | 130 |
| Months of supply | 5.4 | 3.7 |
| Days on market | 48 | 38 |
ShowHide 12-month trend
View the monthly numbers
| Month | Benchmark price | Sold | New listings | Active listings | Months of supply | Days on market | Median price | Average price | Sold vs asking |
|---|---|---|---|---|---|---|---|---|---|
| Oct 2025 | $450,000 | 36 | 56 | 122 | 3.4 | 46 | $462,250 | $475,339 | 98.0% |
| Nov 2025 | $456,900 | 32 | 30 | 98 | 3.1 | 51 | $479,500 | $543,092 | 98.0% |
| Dec 2025 | $442,200 | 21 | 15 | 52 | 2.5 | 40 | $500,000 | $484,043 | 98.0% |
| Jan 2026 | $454,800 | 18 | 77 | 95 | 5.3 | 36 | $479,000 | $557,100 | 98.0% |
| Feb 2026 | $453,300 | 41 | 56 | 99 | 2.4 | 33 | $505,000 | $497,155 | 98.0% |
| Mar 2026 | $454,200 | 38 | 72 | 108 | 2.8 | 29 | $514,150 | $541,324 | 98.0% |
| Apr 2026 | $455,800 | 41 | 76 | 120 | 2.9 | 31 | $473,000 | $498,261 | 98.0% |
| May 2026 | $452,000 | 46 | 105 | 143 | 3.1 | 33 | $465,000 | $523,105 | 98.0% |
| Jun 2026 | $442,300 | 52 | 61 | 122 | 2.4 | 37 | $465,000 | $470,096 | 97.0% |
| Jul 2026 | $438,000 | 44 | 75 | 129 | 2.9 | 36 | $445,750 | $476,418 | 97.0% |
| Aug 2026 | $434,700 | 38 | 51 | 115 | 3.0 | 47 | $480,000 | $571,495 | 97.0% |
| Sep 2026 | $439,600 | 22 | 56 | 118 | 5.4 | 48 | $533,700 | $583,405 | 99.0% |
September 2026 · apartment condos
In September 2026, the benchmark price for West Calgary was $321,700, down 6.6% from September last year. 38 homes sold (down 10%), 66 new listings came on the market (down 33%), and there were 148 active listings at month end (down 19%). Among homes that sold, the median sale price was $319,500 (down 8.6%) and the average sale price was $378,012 (down 7.7%), and homes sold for 97.0% of their asking price. That is 3.9 months of supply, and homes spent 46 days on the market (down 9 days). Figures cover apartment condos.
View the numbers
| Measure | September 2026 | September last year |
|---|---|---|
| Benchmark price | $321,700 | $344,500 |
| Median price | $319,500 | $349,500 |
| Average price | $378,012 | $409,676 |
| Sold vs asking | 97.0% | 97.0% |
| Homes sold | 38 | 42 |
| New listings | 66 | 99 |
| Active listings | 148 | 183 |
| Months of supply | 3.9 | 4.4 |
| Days on market | 46 | 55 |
ShowHide 12-month trend
View the monthly numbers
| Month | Benchmark price | Sold | New listings | Active listings | Months of supply | Days on market | Median price | Average price | Sold vs asking |
|---|---|---|---|---|---|---|---|---|---|
| Oct 2025 | $338,400 | 31 | 66 | 179 | 5.8 | 49 | $319,000 | $363,668 | 96.0% |
| Nov 2025 | $333,900 | 37 | 49 | 145 | 3.9 | 49 | $315,000 | $388,254 | 97.0% |
| Dec 2025 | $328,900 | 22 | 29 | 107 | 4.9 | 57 | $308,250 | $359,982 | 97.0% |
| Jan 2026 | $326,400 | 27 | 79 | 128 | 4.7 | 54 | $308,000 | $343,396 | 97.0% |
| Feb 2026 | $327,200 | 30 | 78 | 155 | 5.2 | 48 | $350,100 | $362,140 | 97.0% |
| Mar 2026 | $323,800 | 39 | 73 | 162 | 4.2 | 42 | $319,500 | $349,444 | 98.0% |
| Apr 2026 | $326,500 | 51 | 83 | 160 | 3.1 | 43 | $352,500 | $368,962 | 98.0% |
| May 2026 | $328,400 | 47 | 85 | 162 | 3.5 | 34 | $330,000 | $366,889 | 98.0% |
| Jun 2026 | $327,300 | 35 | 85 | 173 | 4.9 | 36 | $340,000 | $371,059 | 98.0% |
| Jul 2026 | $326,500 | 45 | 73 | 162 | 3.6 | 50 | $305,000 | $332,793 | 98.0% |
| Aug 2026 | $322,500 | 44 | 73 | 149 | 3.4 | 42 | $330,125 | $336,020 | 97.0% |
| Sep 2026 | $321,700 | 38 | 66 | 148 | 3.9 | 46 | $319,500 | $378,012 | 97.0% |
Source: Calgary Real Estate Board (CREB®) monthly statistics. Benchmark price is the typical price of a home in the area. Median and average prices are for homes that sold in the month. Figures can be revised.
Own a home in this neighbourhood?
See what it is worth today. Get your own Owner Console from Jeff and Shirley Mikolajow: a home value update by email every month, with nearby listings in your area. Free, no obligation.
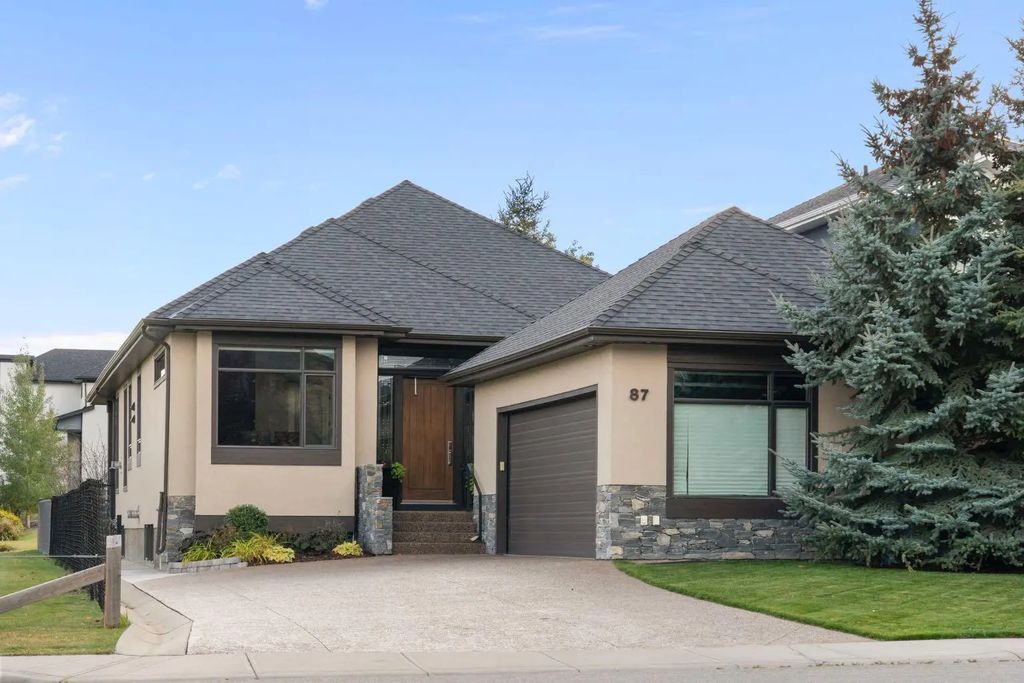
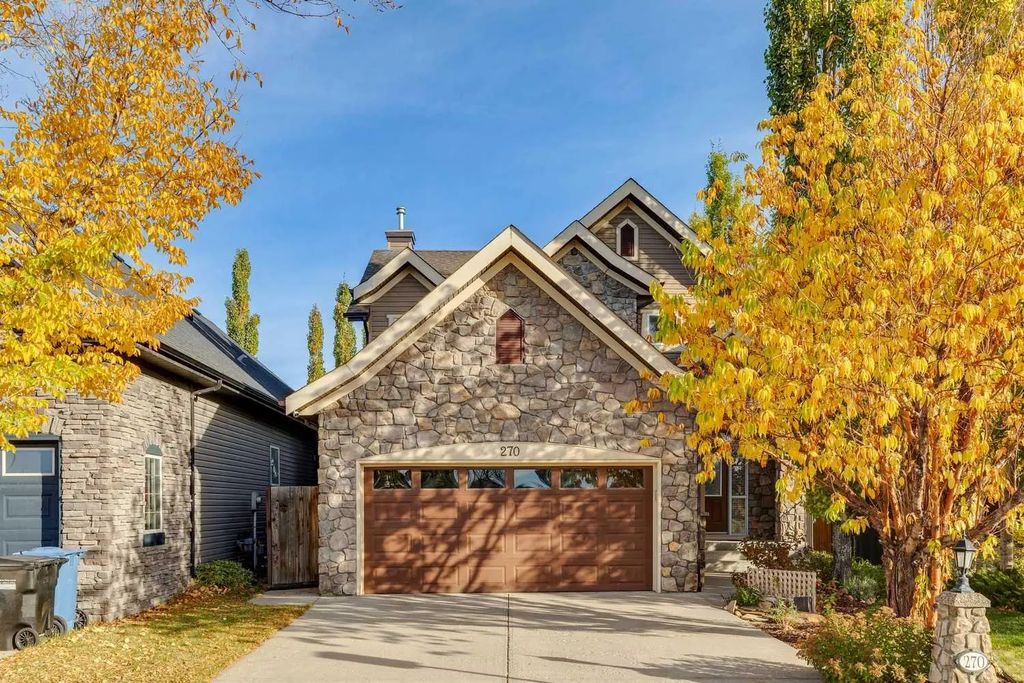
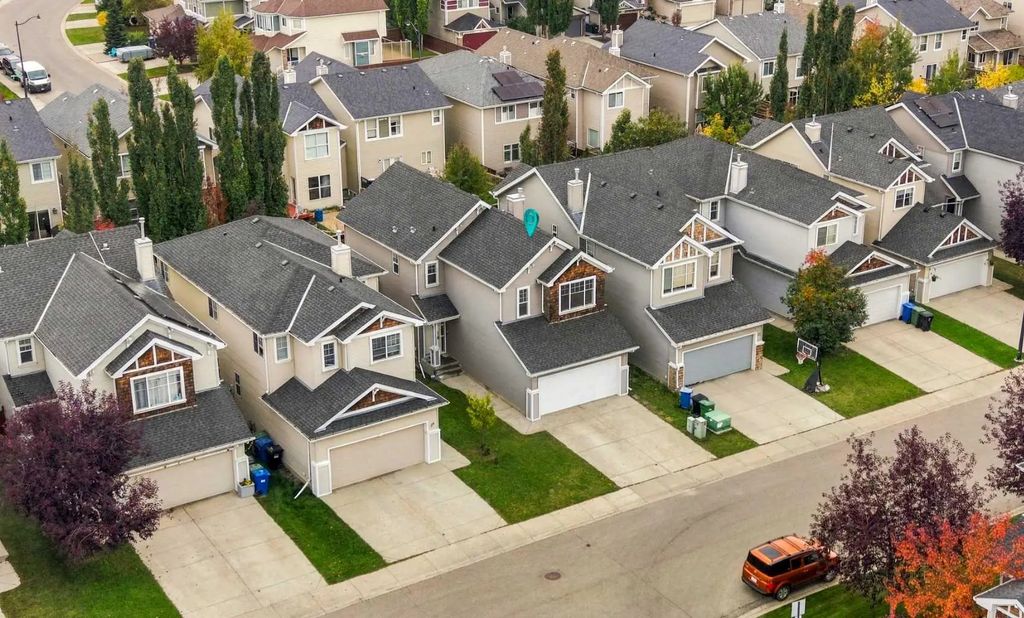
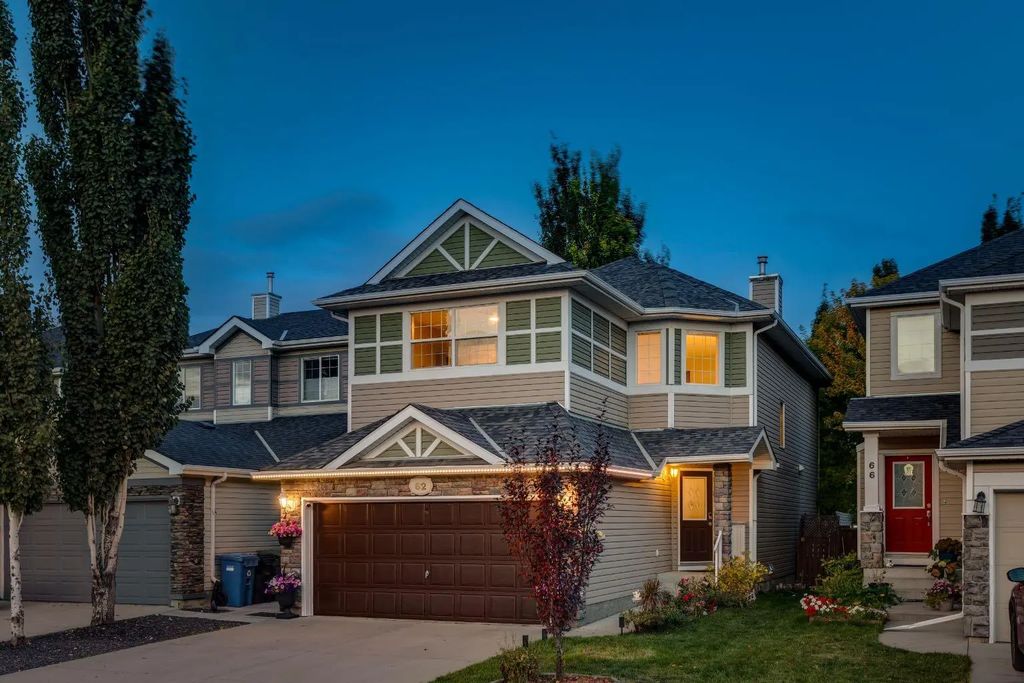
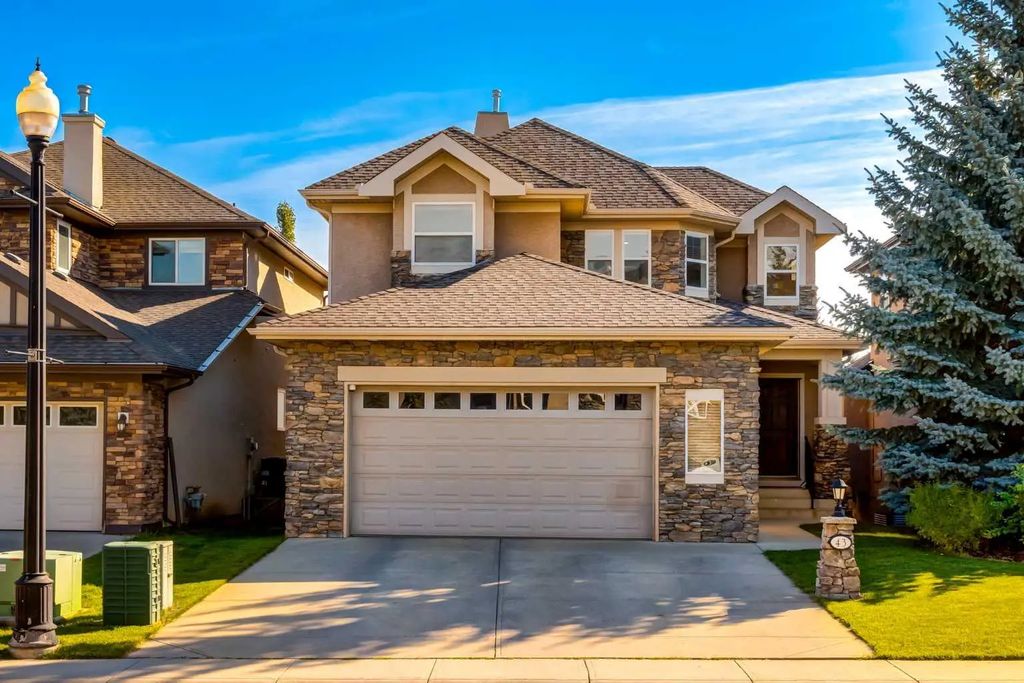
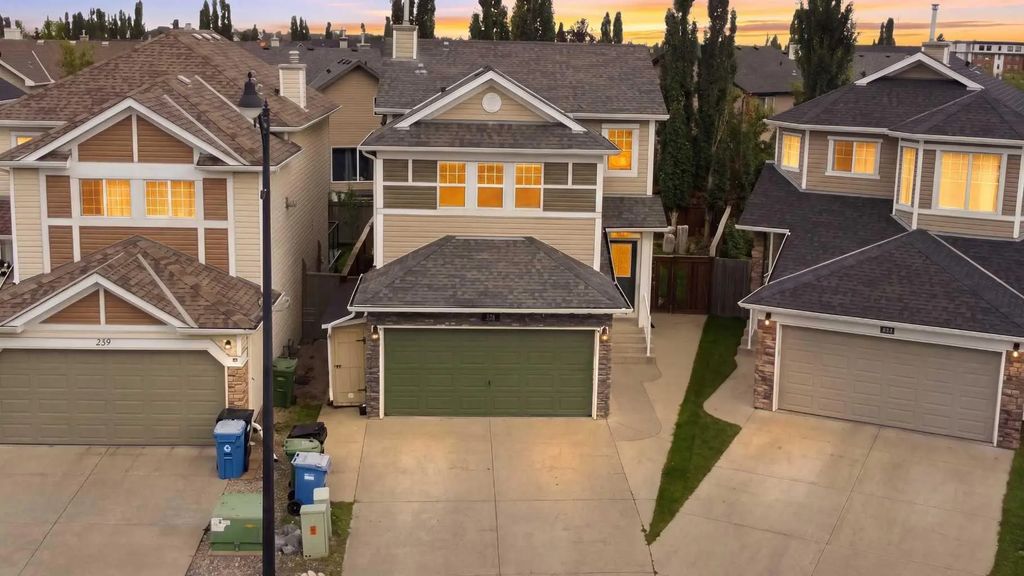
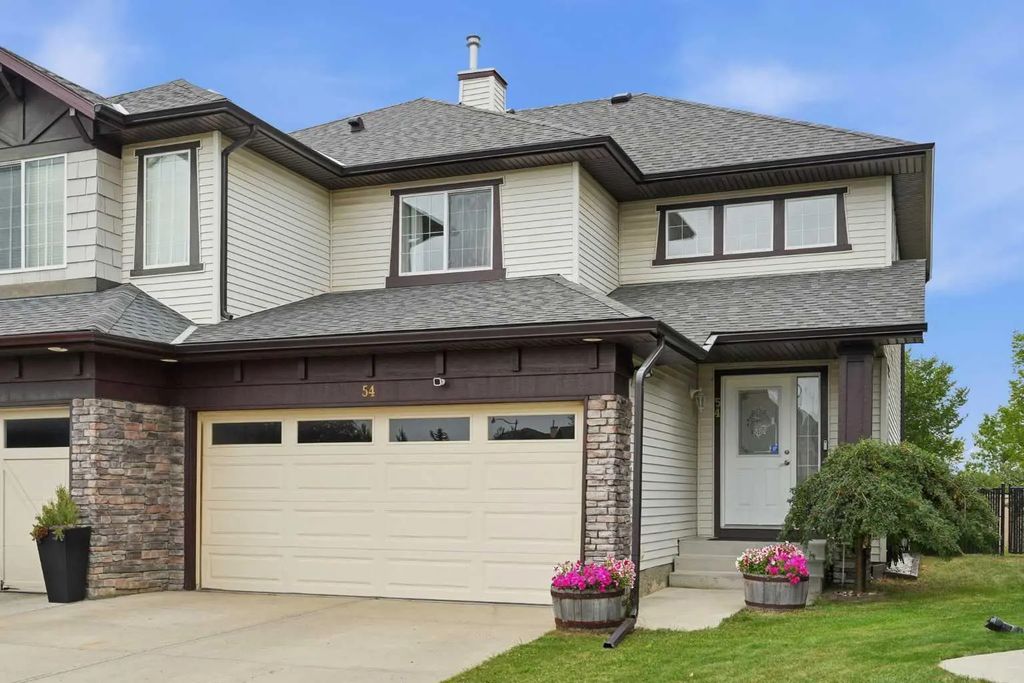
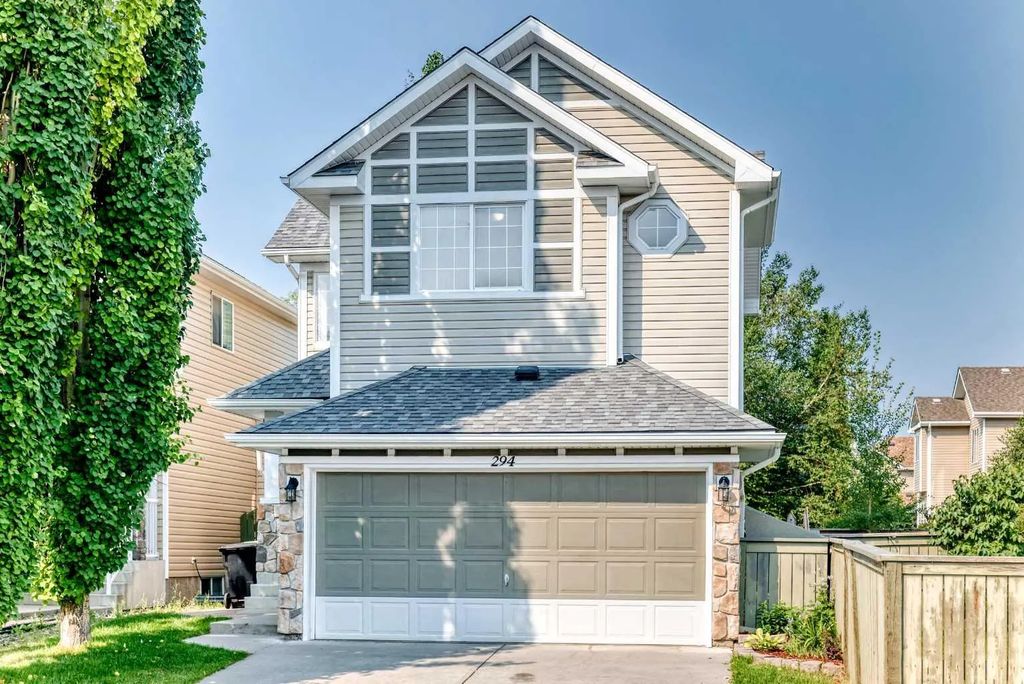
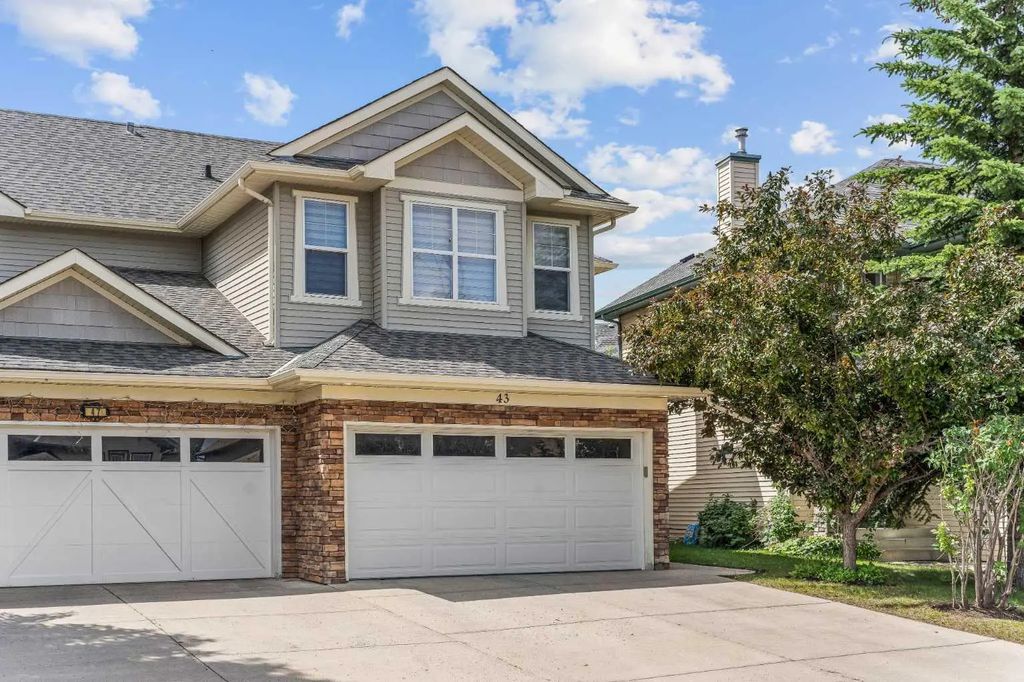
Track My Home's ValueCougar Ridge is a family-oriented community in West Calgary, annexed to the city in 1995 and established as a neighbourhood in 2001. It is bounded by the Paskapoo Slopes and Canada Olympic Park (WinSport) to the north, 69 Street W to the east, 101 Street W to the west, and Old Banff Coach Road to the south. The community grew quickly through the 2000s and reached close to 6,000 residents by 2012, making it one of the larger and more established communities among West Calgary's newer developments. Housing consists mainly of single-family homes alongside some townhomes. Families have access to Calgary French & International School and Calgary Waldorf School, both located within the community. Its position beside the Paskapoo Slopes natural area and Canada Olympic Park gives residents easy access to hiking, mountain biking, and skiing, while Old Banff Coach Road connects to nearby West Springs and Aspen Woods for additional shopping and schools.
- All Listings
- $100,000 - $200,000
- $400,000 - $500,000
- $600,000 - $700,000
- $700,000 - $800,000
- $800,000 - $900,000
- $900,000 - $1,000,000
- Over $1,000,000




Frequently Asked Questions About Cougar Ridge
What type of homes are available in Cougar Ridge?
Cougar Ridge is made up mainly of single-family homes built from the early 2000s onward, along with some townhomes. It was one of the faster-growing West Calgary communities of the 2000s, reaching nearly 6,000 residents by 2012.
Is Cougar Ridge a good area for families?
Yes. Calgary French & International School and Calgary Waldorf School are both located within Cougar Ridge, and the community backs onto the Paskapoo Slopes natural area, giving families direct access to trails and green space.
What amenities are near Cougar Ridge?
Canada Olympic Park (WinSport) borders the community to the north, offering skiing, mountain biking, and year-round recreation. Old Banff Coach Road connects residents to shopping and schools in neighbouring West Springs and Aspen Woods.
I’m a homeowner in West Calgary. What’s the best way to track my home’s value?
The easiest way is a free Owner Console from Jeff and Shirley Mikolajow. You get a home value update by email every month, plus nearby listings in West Calgary, with no cost or obligation. Get your free Owner Console.
Other Great Neighbourhoods in West Calgary
- Aspen Woods
- Christie Park Estate
- Coach Hill
- Cougar Ridge
- Crestmont
- Discovery Ridge
- Garrison Green
- Glamorgan
- Glenbrook
- Glendale Meadows
- Lakeview
- Lakeview Village
- Lincoln Park
- North Glenmore Park
- Prominence Patterson
- Rosscarrock
- Rutland Park
- Signal Hill
- Springbank Hill
- Spruce Cliff
- Strathcona Park
- The Slopes
- Wentworth
- West Hills
- West Springs
- Westgate
- Wildwood
- Medicine Hill
- Osprey Hill
- Valley Ridge